Enable / 2025 to 2026
Analytics two companies can trust
Designing Enable's AI-powered analytics, and extending it to the partner on the other side of the deal.
TL;DR
- Enable manages rebate programs, incentive deals worth millions between manufacturers, distributors, and buying groups. I owned design for its embedded AI analytics module (AI-Powered Analytics, built on ThoughtSpot) from just after its first launch, and designed everything that followed: the AI search experience, the design-system integration, and its evolution into a partner-facing product.
- I also ran the research engine behind it: a strategic-customer interview program I designed, scripted, and led; five internal adoption-barrier studies; and expert interviews that validated the company's dashboard design standards.
- The research kept landing on one theme: trust, in the source data, in the AI's answers, and between trading partners who each kept their own version of the truth. Every AI-UX decision in the product traces back to a specific finding.
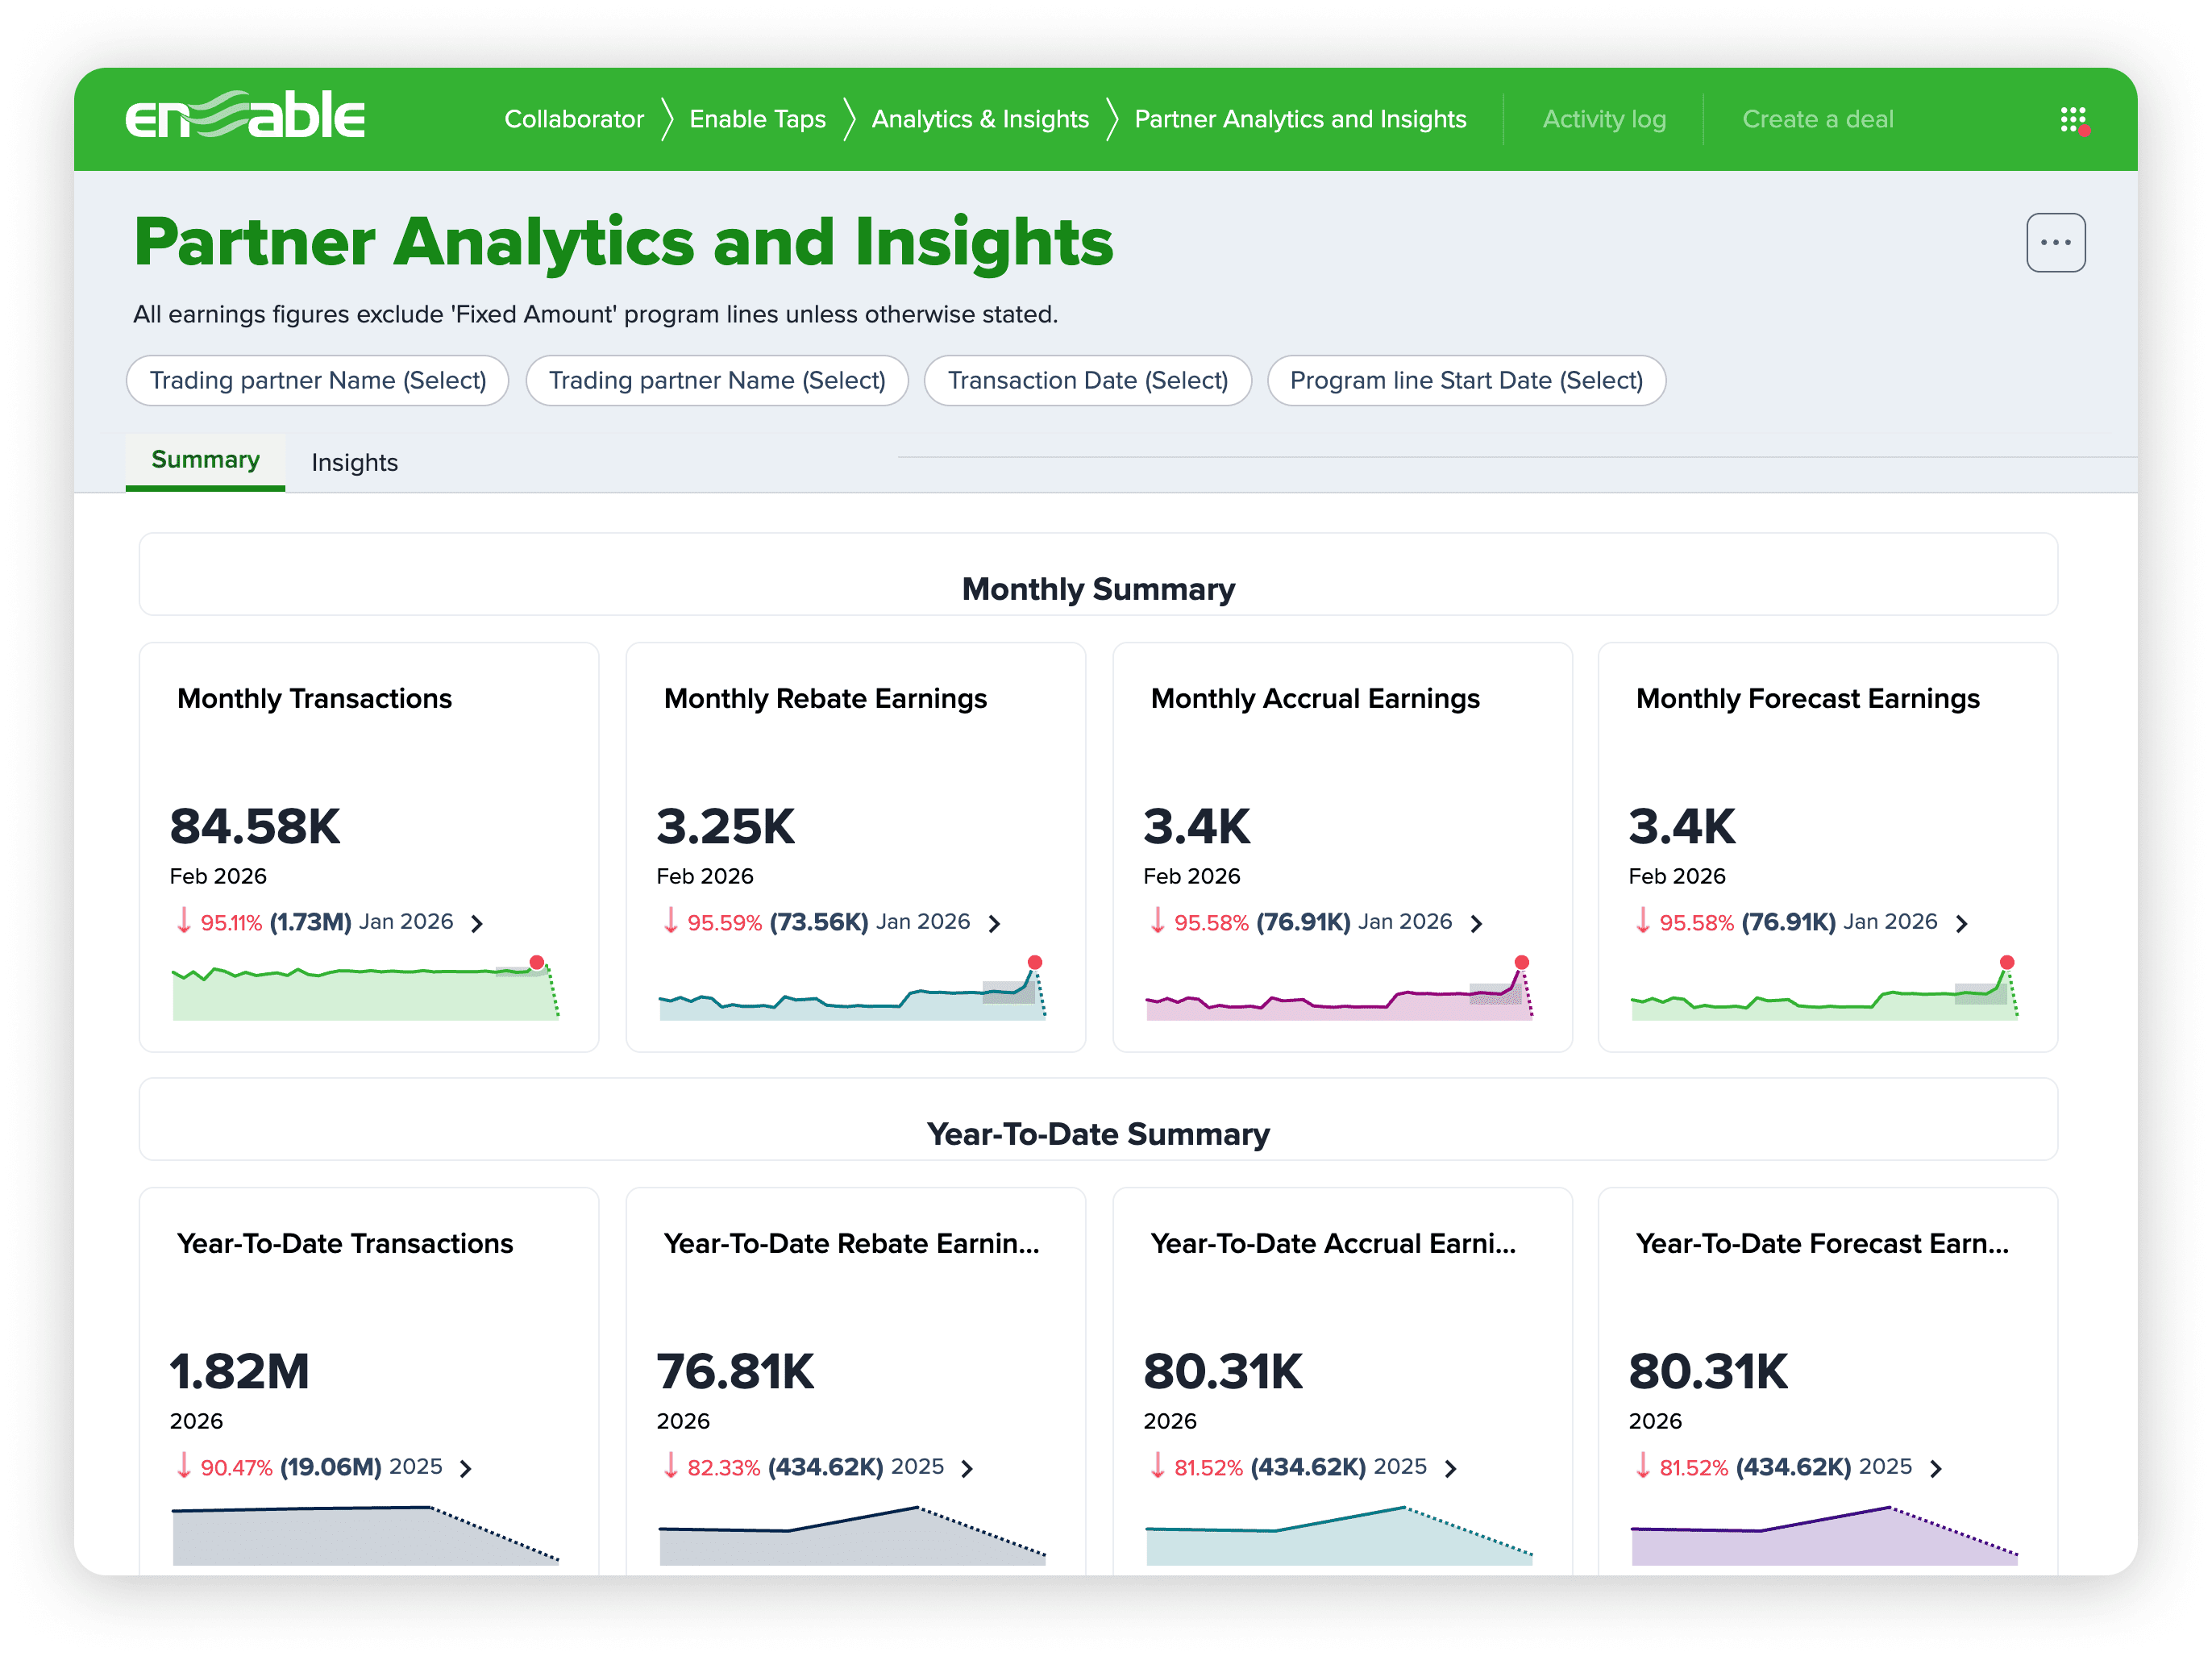
- The result was Partner Analytics & Insights: customers customize live AI-powered dashboards and share them with trading partners in the portal those partners already use, replacing a static legacy dashboard that had churned 22 accounts over what it couldn't show.
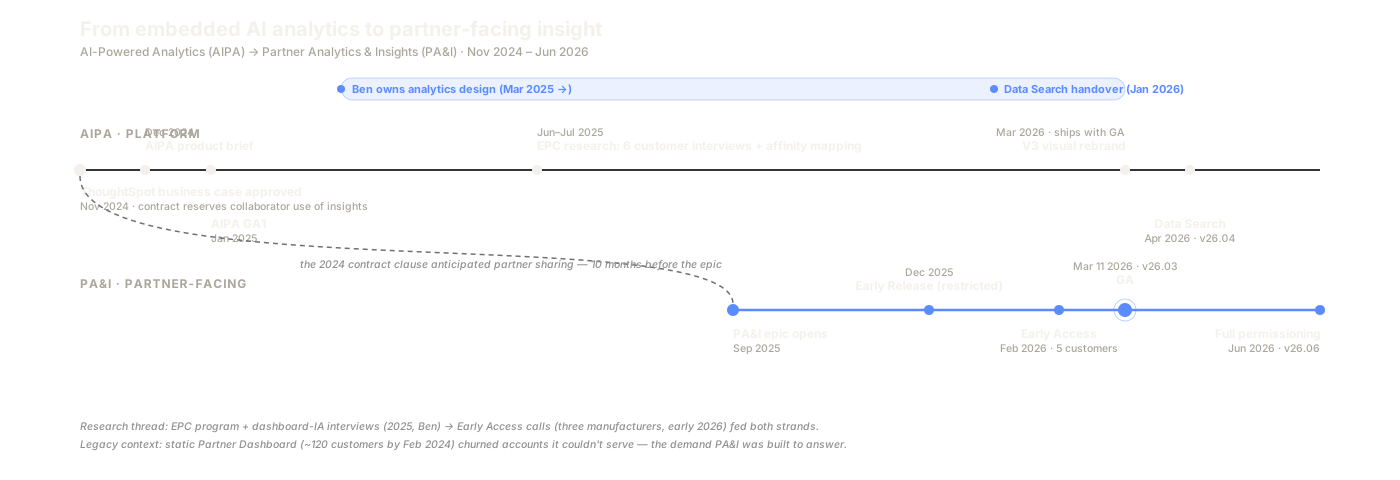
- Shipped to GA March 11, 2026, on plan, with full partner permissioning following in June 2026. I'm credited as the launch team's designer. Adoption wobbled early, recovered through the research-driven iteration, and the program went on to hit its $4M expansion-ARR goal.
(1)
Context: a rebate platform learns to explain itself
Enable sits between companies that trade with each other. A manufacturer and a distributor agree on rebates, hit $2M in purchases, earn 4% back, and Enable becomes the system of record for those agreements, the transactions behind them, and the money that moves when targets are hit.
In late 2024, Enable made a documented bet: rather than spend an estimated three to five years and a thirty-engineer team building analytics in-house, it embedded ThoughtSpot, and committed to making AI-driven analysis a core platform capability. The first version (sales demo → early access → GA1, January 2025) was designed by my predecessor. I took over analytics design after that first launch, everything from GA Phase II onward was mine, through to the partner-facing product this story ends with. I'm named as Designer on the GA Phase II and Phase III product briefs, and as Product Design on the Partner Analytics & Insights launch team.
The cast: a PM, an engineering squad of about six led day-to-day by an eng lead, and a PMM. I was the designer of record, the only designer named on the briefs and the launch team, handing the Data Search feature to a colleague in January 2026.
(2)
The problem: shared truth, one-sided visibility
A rebate agreement is a deal between two companies, but only one of them could see the data. The other side got a static export, a periodic email, or nothing.
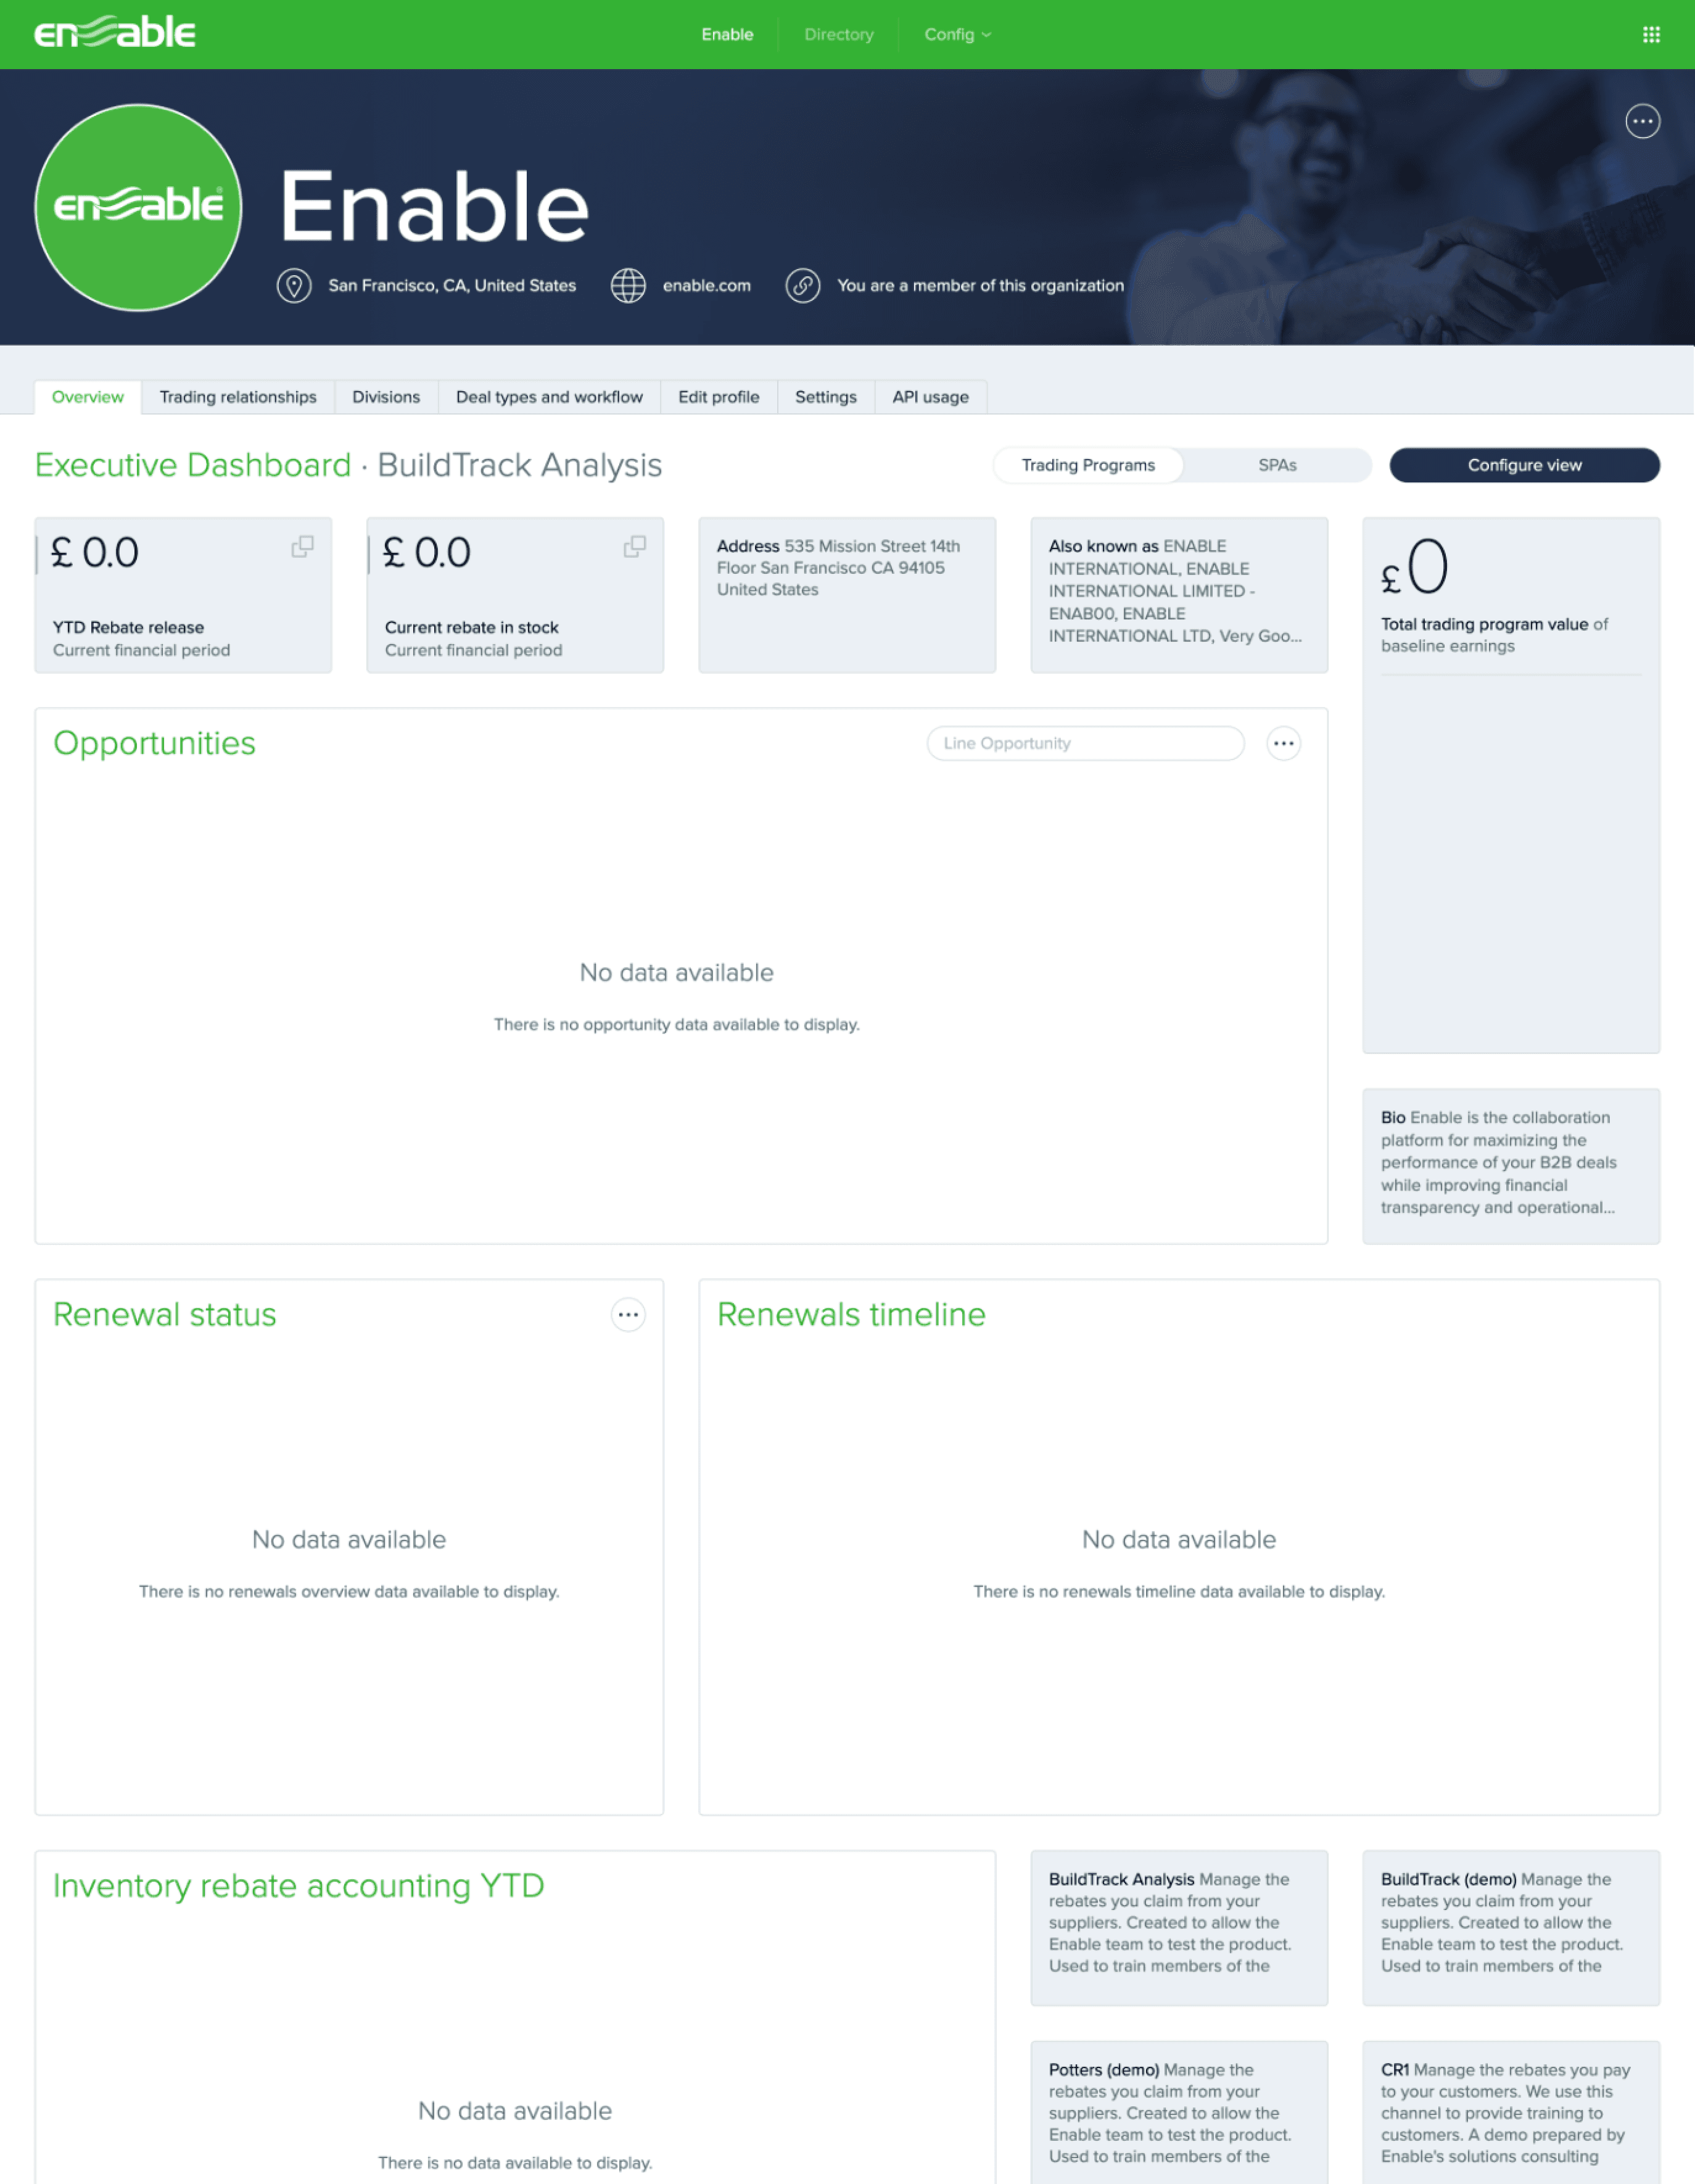
Enable already had proof this mattered. Its legacy Partner Dashboard, a fixed, non-configurable external view, had been bought by roughly 110 to 120 customers, about 30% of the customer base. The demand was real; the product couldn't meet it. It churned 22 customers and ~$112K ARR, the brief's own read: the tool was “lacking the ability to serve the data customers wanted”, and by the end of 2025 it averaged just 13 daily users. Support tickets told the same story: 49 customization requests from 18 customers. Customers filled the gap manually, downloading earnings reports, rebuilding them in Excel and Tableau, emailing partners how far off-target they were.
The sharpest articulation came out of the June 2025 research sprint I designed and ran. A supplier executive, asked about giving partners access, said:
“No executive is going to go and create an account in Enable when they have 500 suppliers.”
Supplier executive, strategic-customer interview, June 2025
That sentence carries the whole design constraint: the consuming audience would never adopt a BI tool, never attend a training, never log into one more system per supplier. Whatever we built had to land inside something partners already used, and earn trust instantly, because the numbers on screen are the numbers money moves on.
The business stakes were equally documented: the analytics business case identified 22 customers and roughly $3M of ARR at churn risk over data-analysis gaps, coincidentally also 22, but a different set of customers than the dashboard churn above. And remarkably, the partner-facing extension was anticipated in the vendor contract itself, Enable negotiated written confirmation that trading partners, not just customers, could make use of the insights, in November 2024, ten months before the partner-analytics epic existed. The arc of this story was the plan, not an accident.
(3)
Research: finding out what “trust” actually means
When I inherited the platform, it had a louder problem than partner sharing: customers who had bought AI-powered analytics weren't using it. An internal plan from June 2025 records that “25 customers were anticipated to be using the product by now, many have yet to be fully onboarded.” Before designing anything new, I needed to know why.
I built the research program in three layers:
Internal first. Five interviews with the implementation analysts and CSMs closest to real accounts (May 2025), each written up individually, cheap signal before customer time.
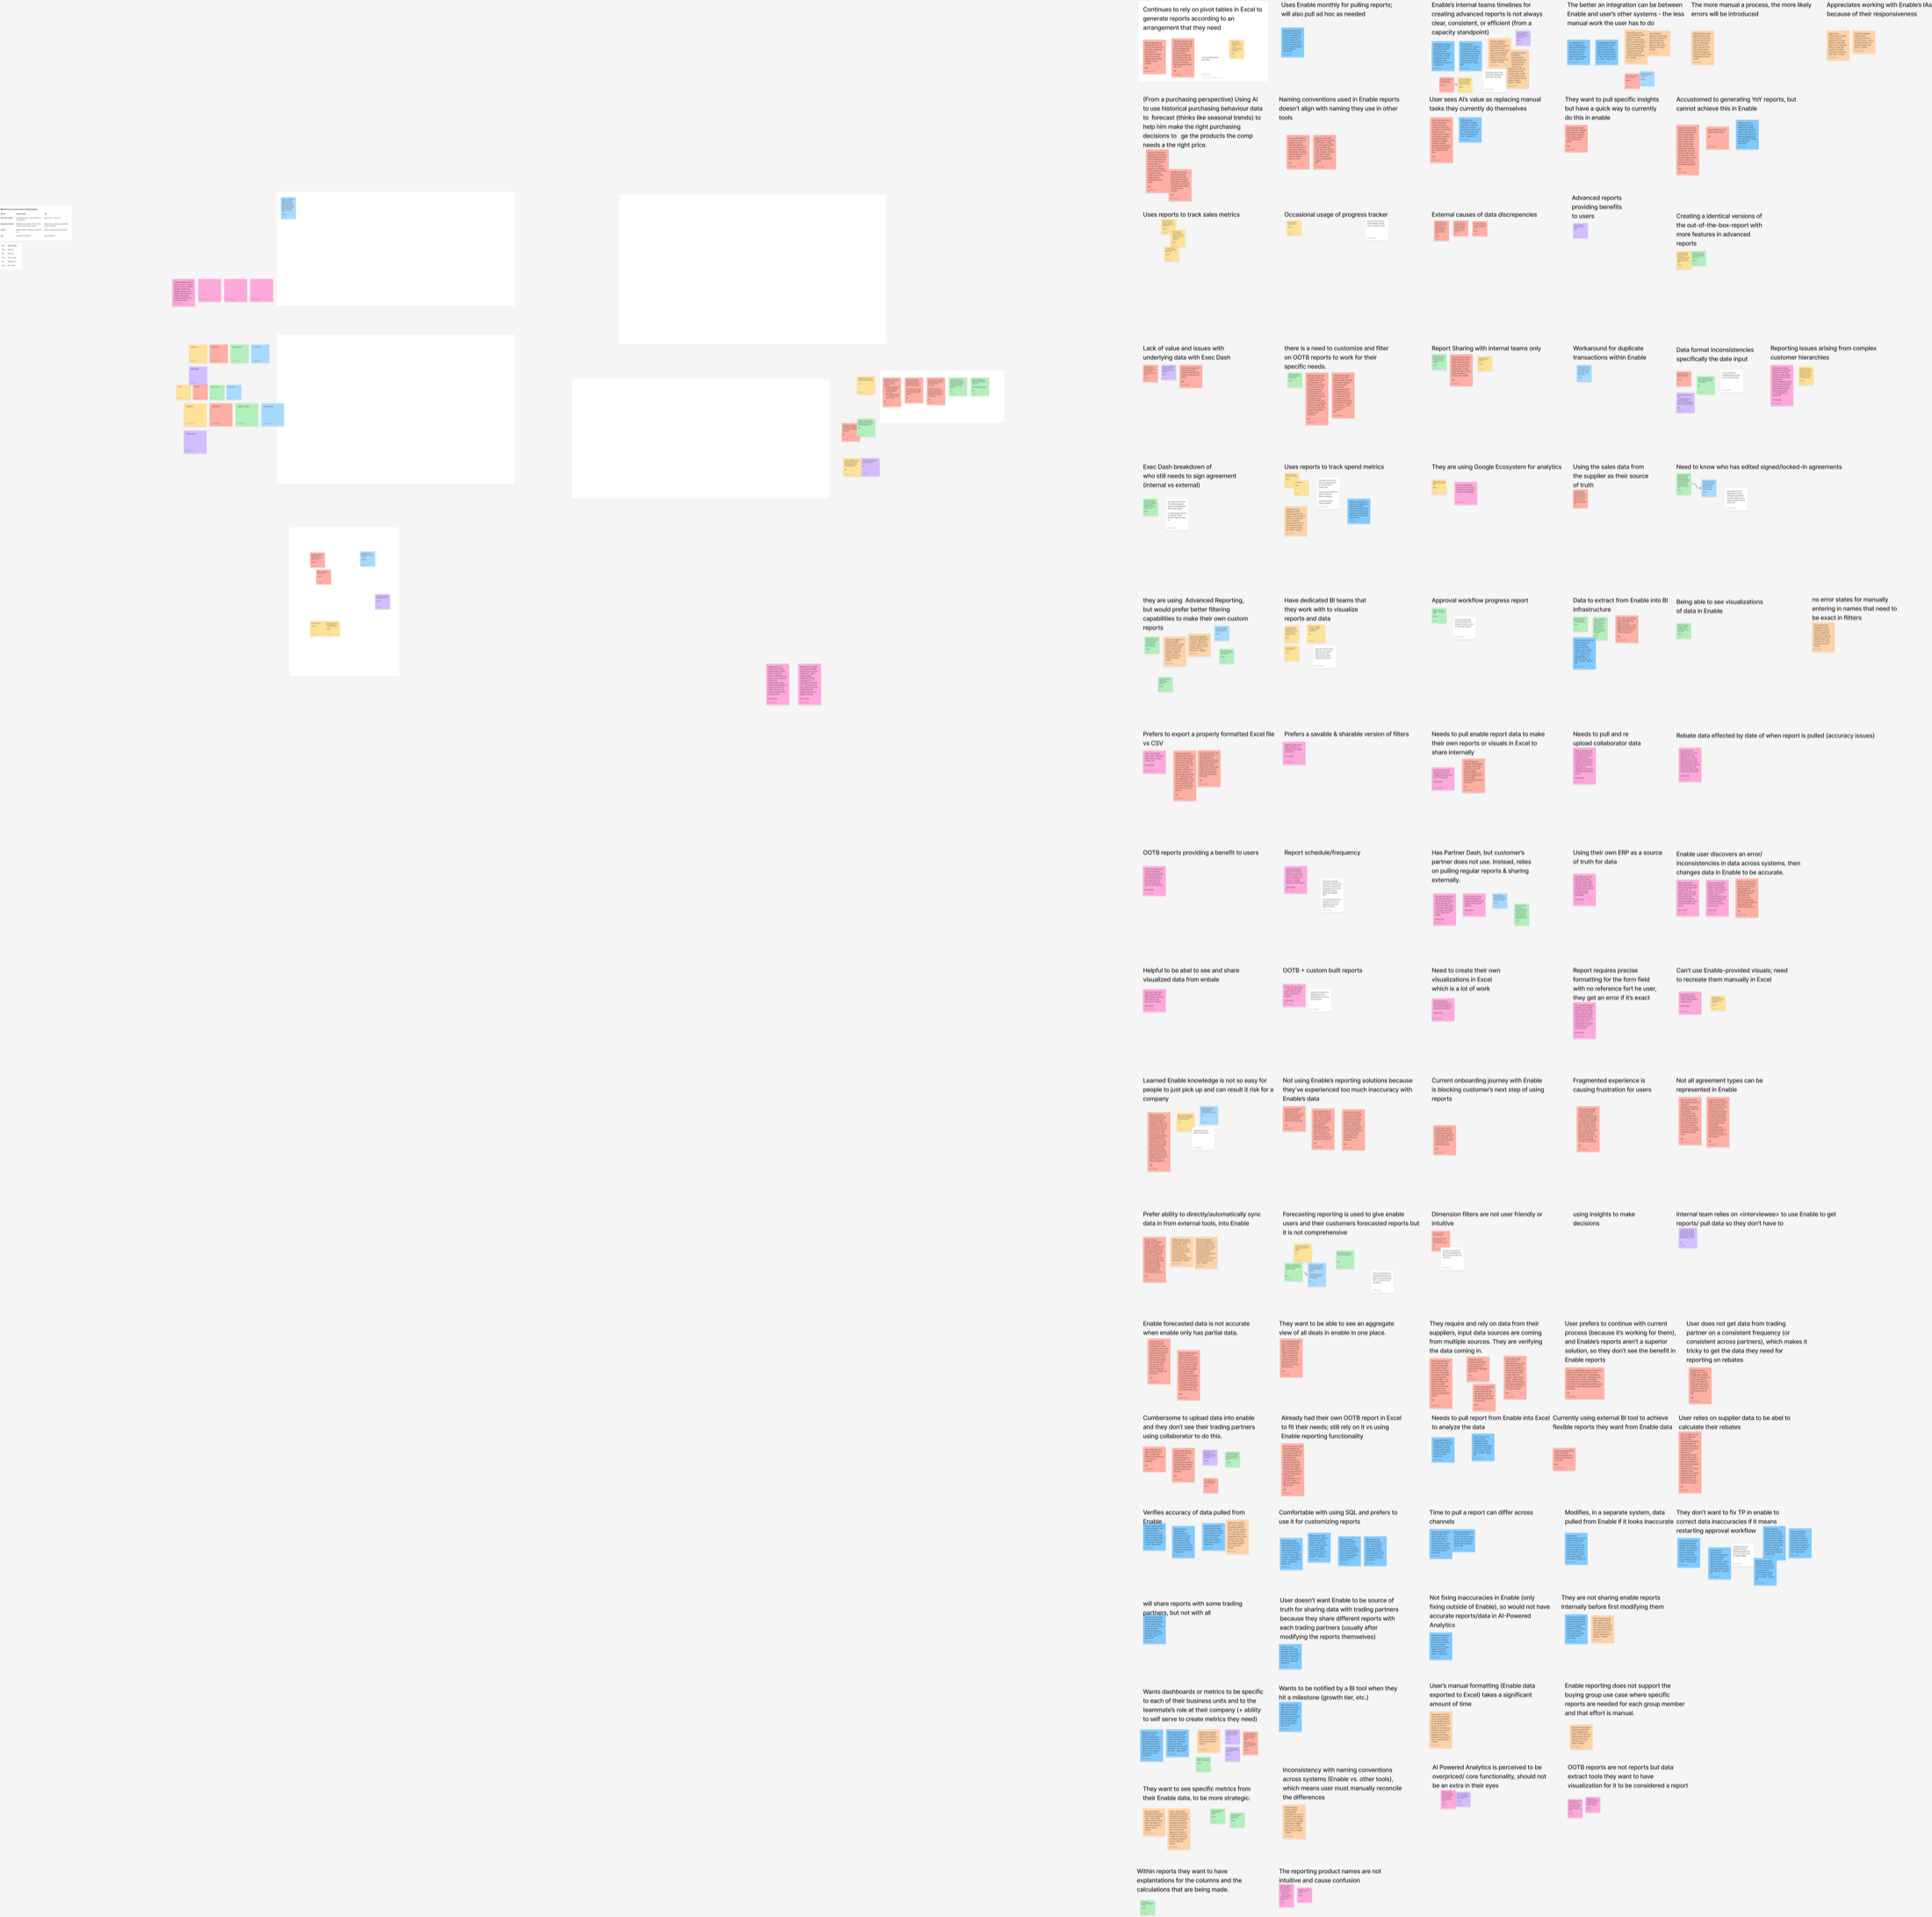
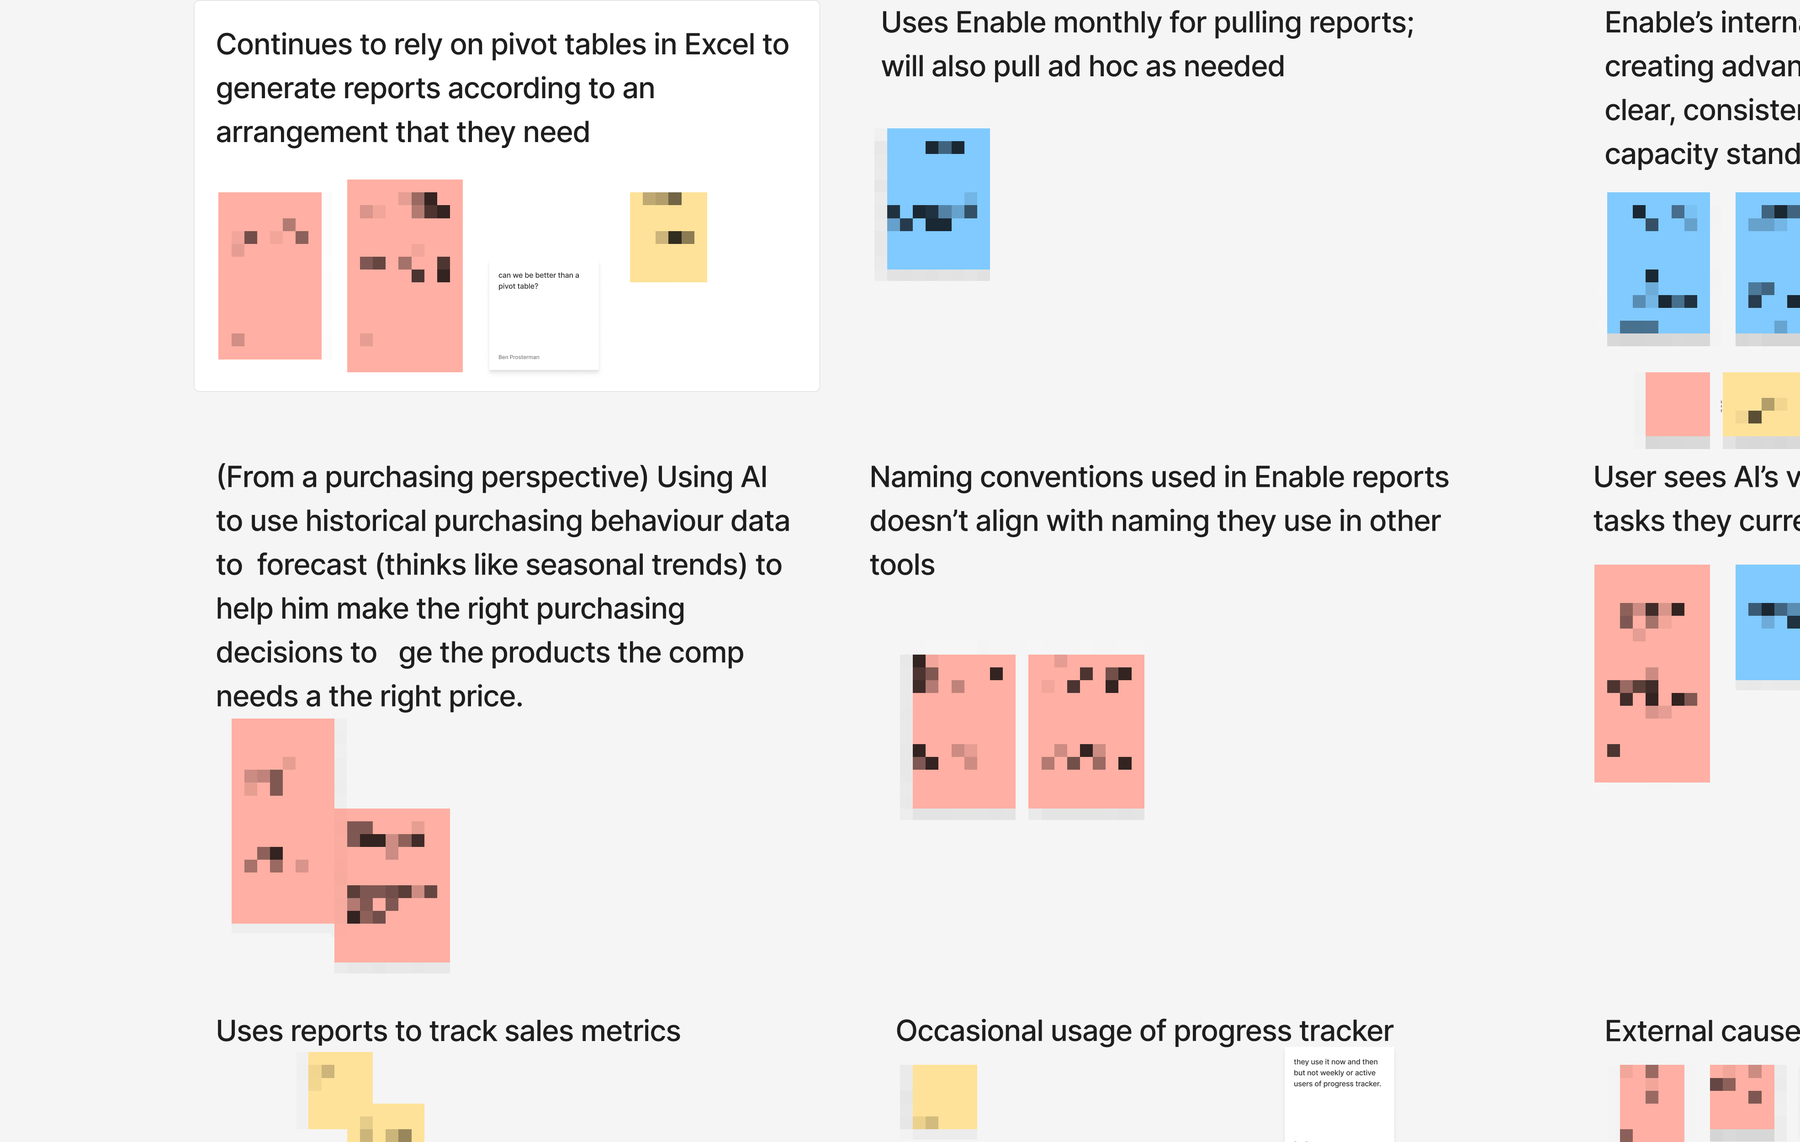
Then strategic customers. I designed and scripted the Enable Product Council research sprint, seven sessions in June 2025 with strategic customers, and was in the room for all seven: I moderated four, and our PM moderated the other three while I ran live notes. The synthesis distilled six interviews into 235 affinity-mapped notes across ~30 themes:
- 6 of 6 customers relied on external tools (Excel, Tableau, Power BI) for analysis Enable should have answered, one finance manager had been iterating the same Excel workbook for nine years.
- Trust in source data was the first barrier: 4 of 6 raised data-trust concerns; customers cross-checked our numbers before believing them.
- Skepticism about the AI itself was open, one account dismissed it as “a BI tool” that didn't add value, another said it had “not true AI components yet”, and analytics felt useful only at year-end, when it was too late to change behavior.
Then the partner question. For the partner-facing concept I rewrote the discovery plan's framing and script (the PM's comment: “Looks good :)”), walked a customer through the working prototype on a live call using a script I authored, and drew on the early-access calls, run by our PMM, with three early-access manufacturers for the consuming-audience reality. One early-access customer's deal-breaker on the legacy product was that it had exposed a full list of their customer names to anyone with access, confidentiality between partners was itself a trust requirement.
Separately, I took the dashboard-construction rules the team had inherited in outline, published them as the company's working standards, ≤4 tabs, ≤4 KPIs per view, ≤6 visualizations per tab, and then pressure-tested them through an expert-interview series with the analysts who build customer dashboards. The findings got a one-line review I'll take: “credit to Ben for output!” in the PMM retro.
(4)
Constraints and strategy: designing on a rented platform
Everything here was designed inside someone else's product. ThoughtSpot is an embed: its components, its interaction grammar, its release train. I wrote the design-org's data-visualization strategy that year, a build-vs-embed analysis of D3, Recharts, and ThoughtSpot, and the line I keep coming back to from it is the tradeoff I then lived for twelve months: with a vendor platform it is “difficult to enforce our design system.”
The constraints were concrete, and I made documenting them part of the design work:
- Copy can't branch. ThoughtSpot string IDs are global, one string everywhere it appears. A 30-comment thread on my share-modal copy ticket ends with the PM accepting a compromise phrasing, while I was on leave; more on that below, because conditional copy was impossible.
- The modal system only bends so far. My Modal 2.0 alignment ticket doubles as a constraint document: which parts of the vendor modal we could restyle, which we couldn't.
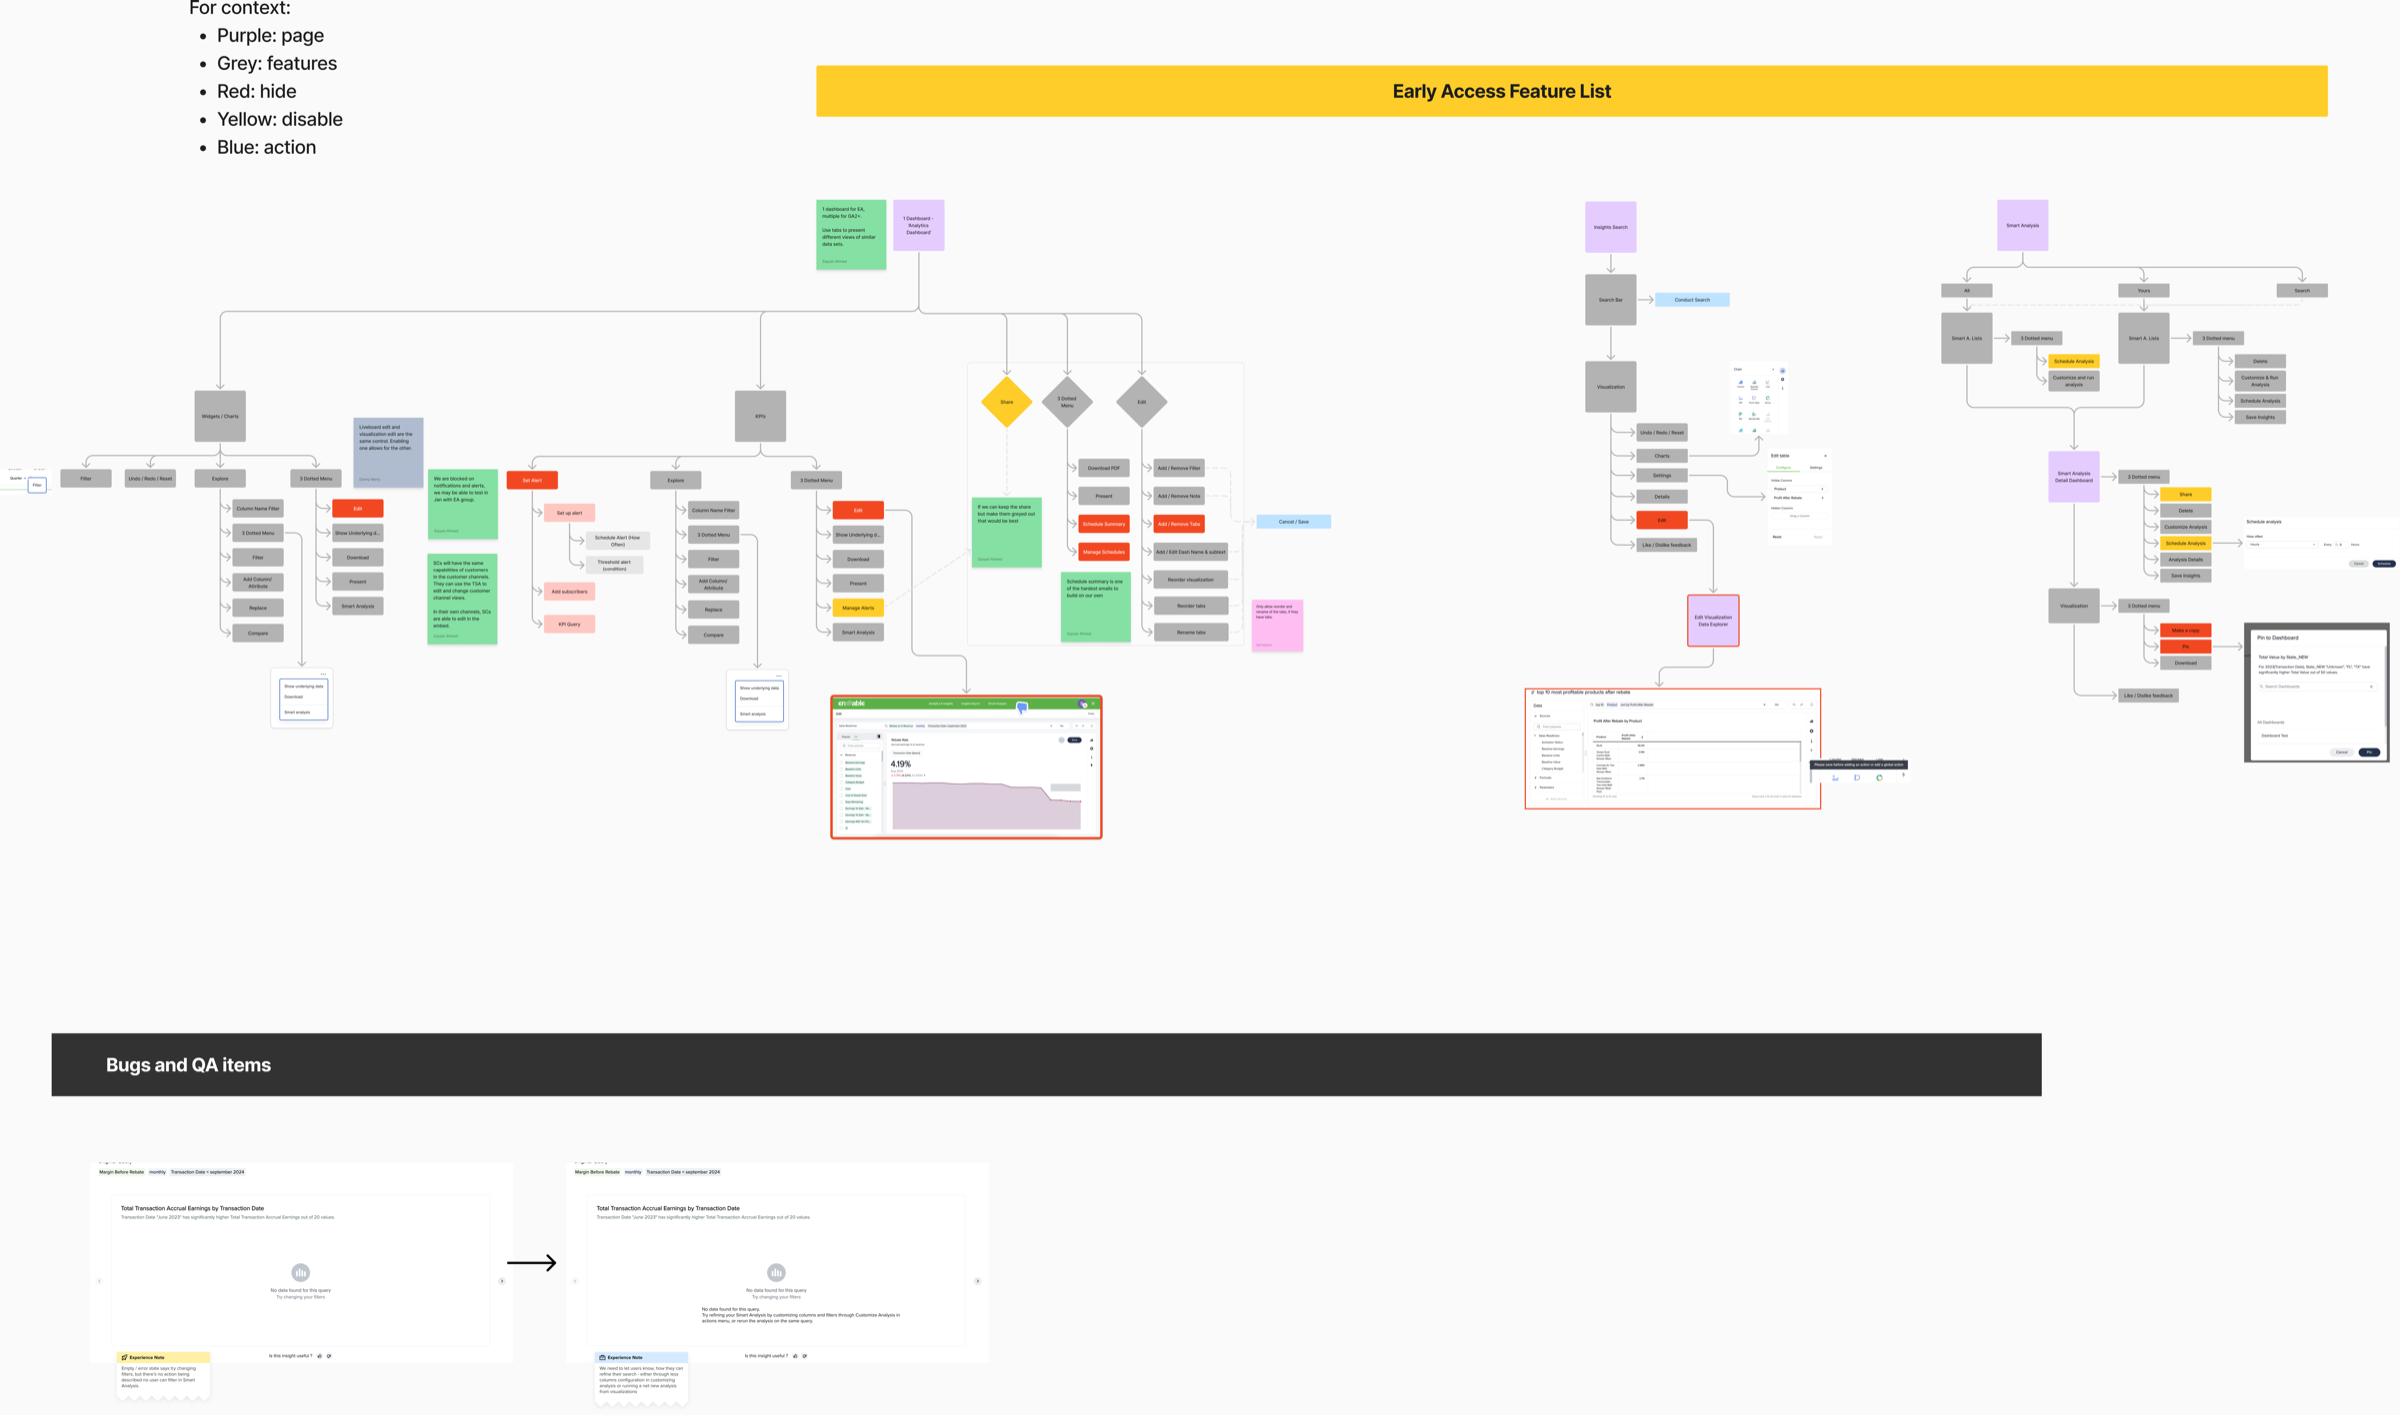
- The embed has a vocabulary. Engineering catalogued the ~25 SDK action flags that decide what each audience can do, that list, not a Figma file, was the real control surface for designing the partner experience.
- The AI has limits. A conversational-AI spike measured ~19-second response times, and ThoughtSpot's period-over-period comparison will happily declare “June is 99.88% lower than May” when “June” is a partial month measured against all of May. Both findings bounded what the experience could responsibly promise.
Strategy, given all that:
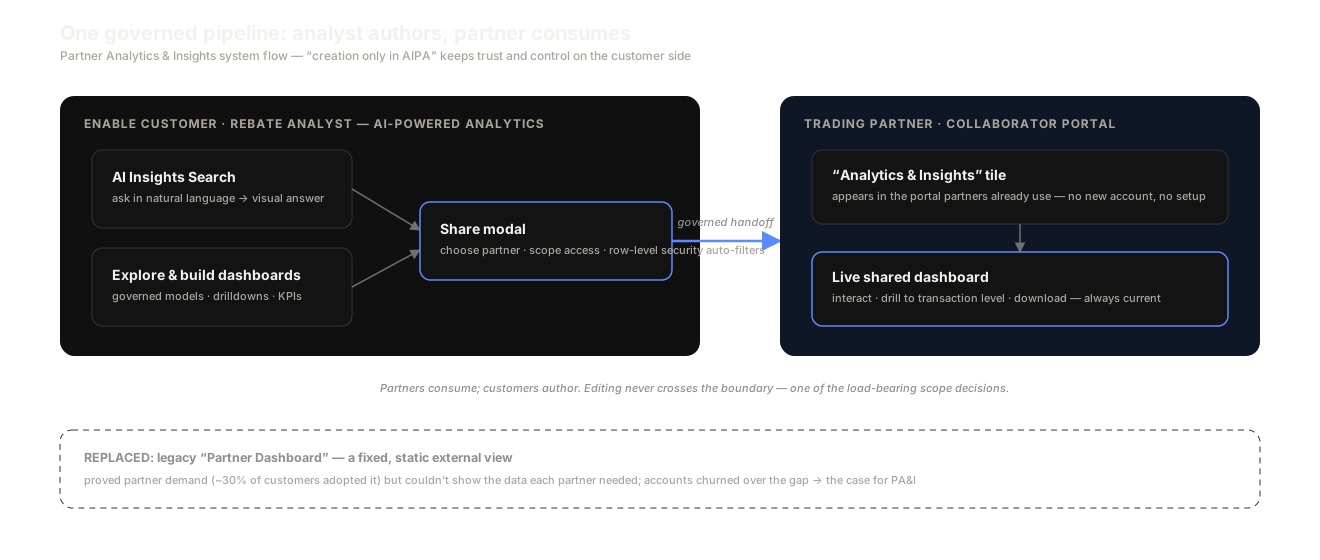
Authoring stays with the analyst; partners only consume.
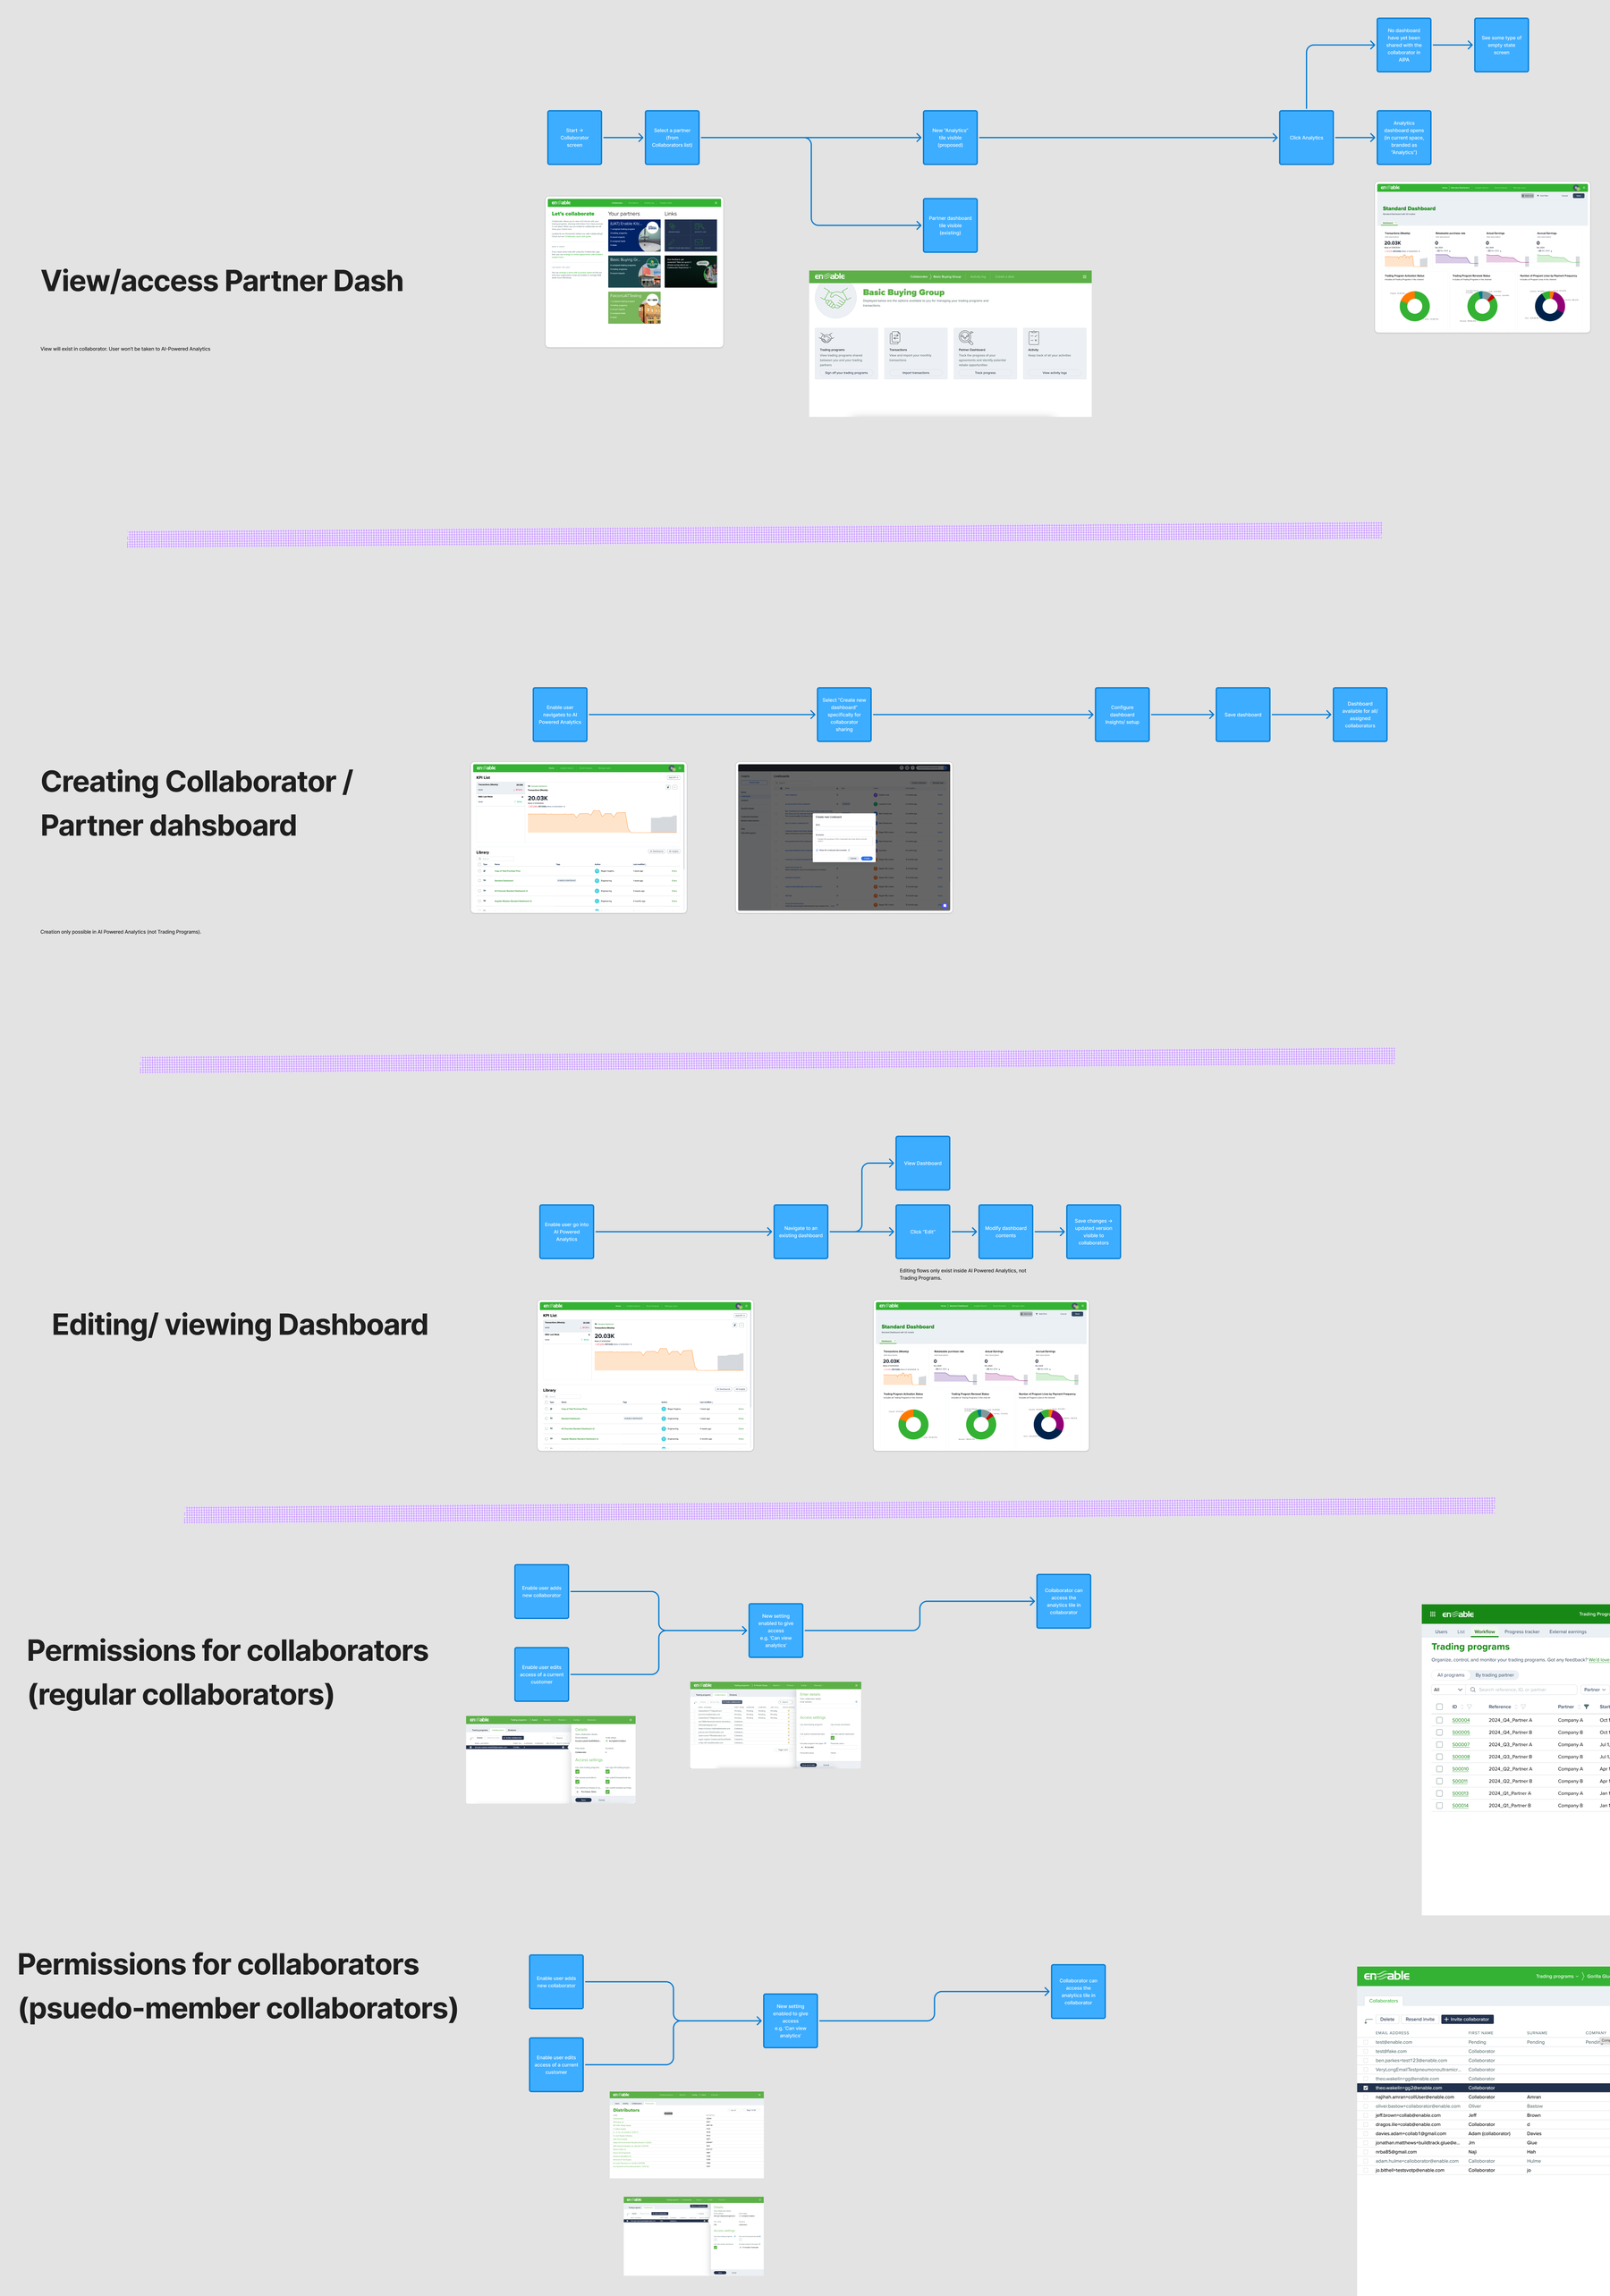
Dashboard creation, editing, and AI exploration live in AI-Powered Analytics on the customer side; partners get an embedded, permission-filtered view. My flow annotations say it plainly: “Creation only possible in AI Powered Analytics.” The alternatives are on the record: parallel stories for authoring the shared dashboard in the vendor admin versus inside AIPA were drafted, argued, engineering doubted the one-dashboard-per-tenant rule could be enforced, and descoped from Early Release to ship sooner, with my canvas note proposing the eventual fix: a Create Dashboard flow in AIPA that mirrors the admin path.
Trust by architecture, not promises.
Partner access rides Enable's existing trading-partner model with row-level security auto-filtering, a partner cannot see another partner's data, and the AI's answers are bounded by the same permissions.
Meet partners where they already are.
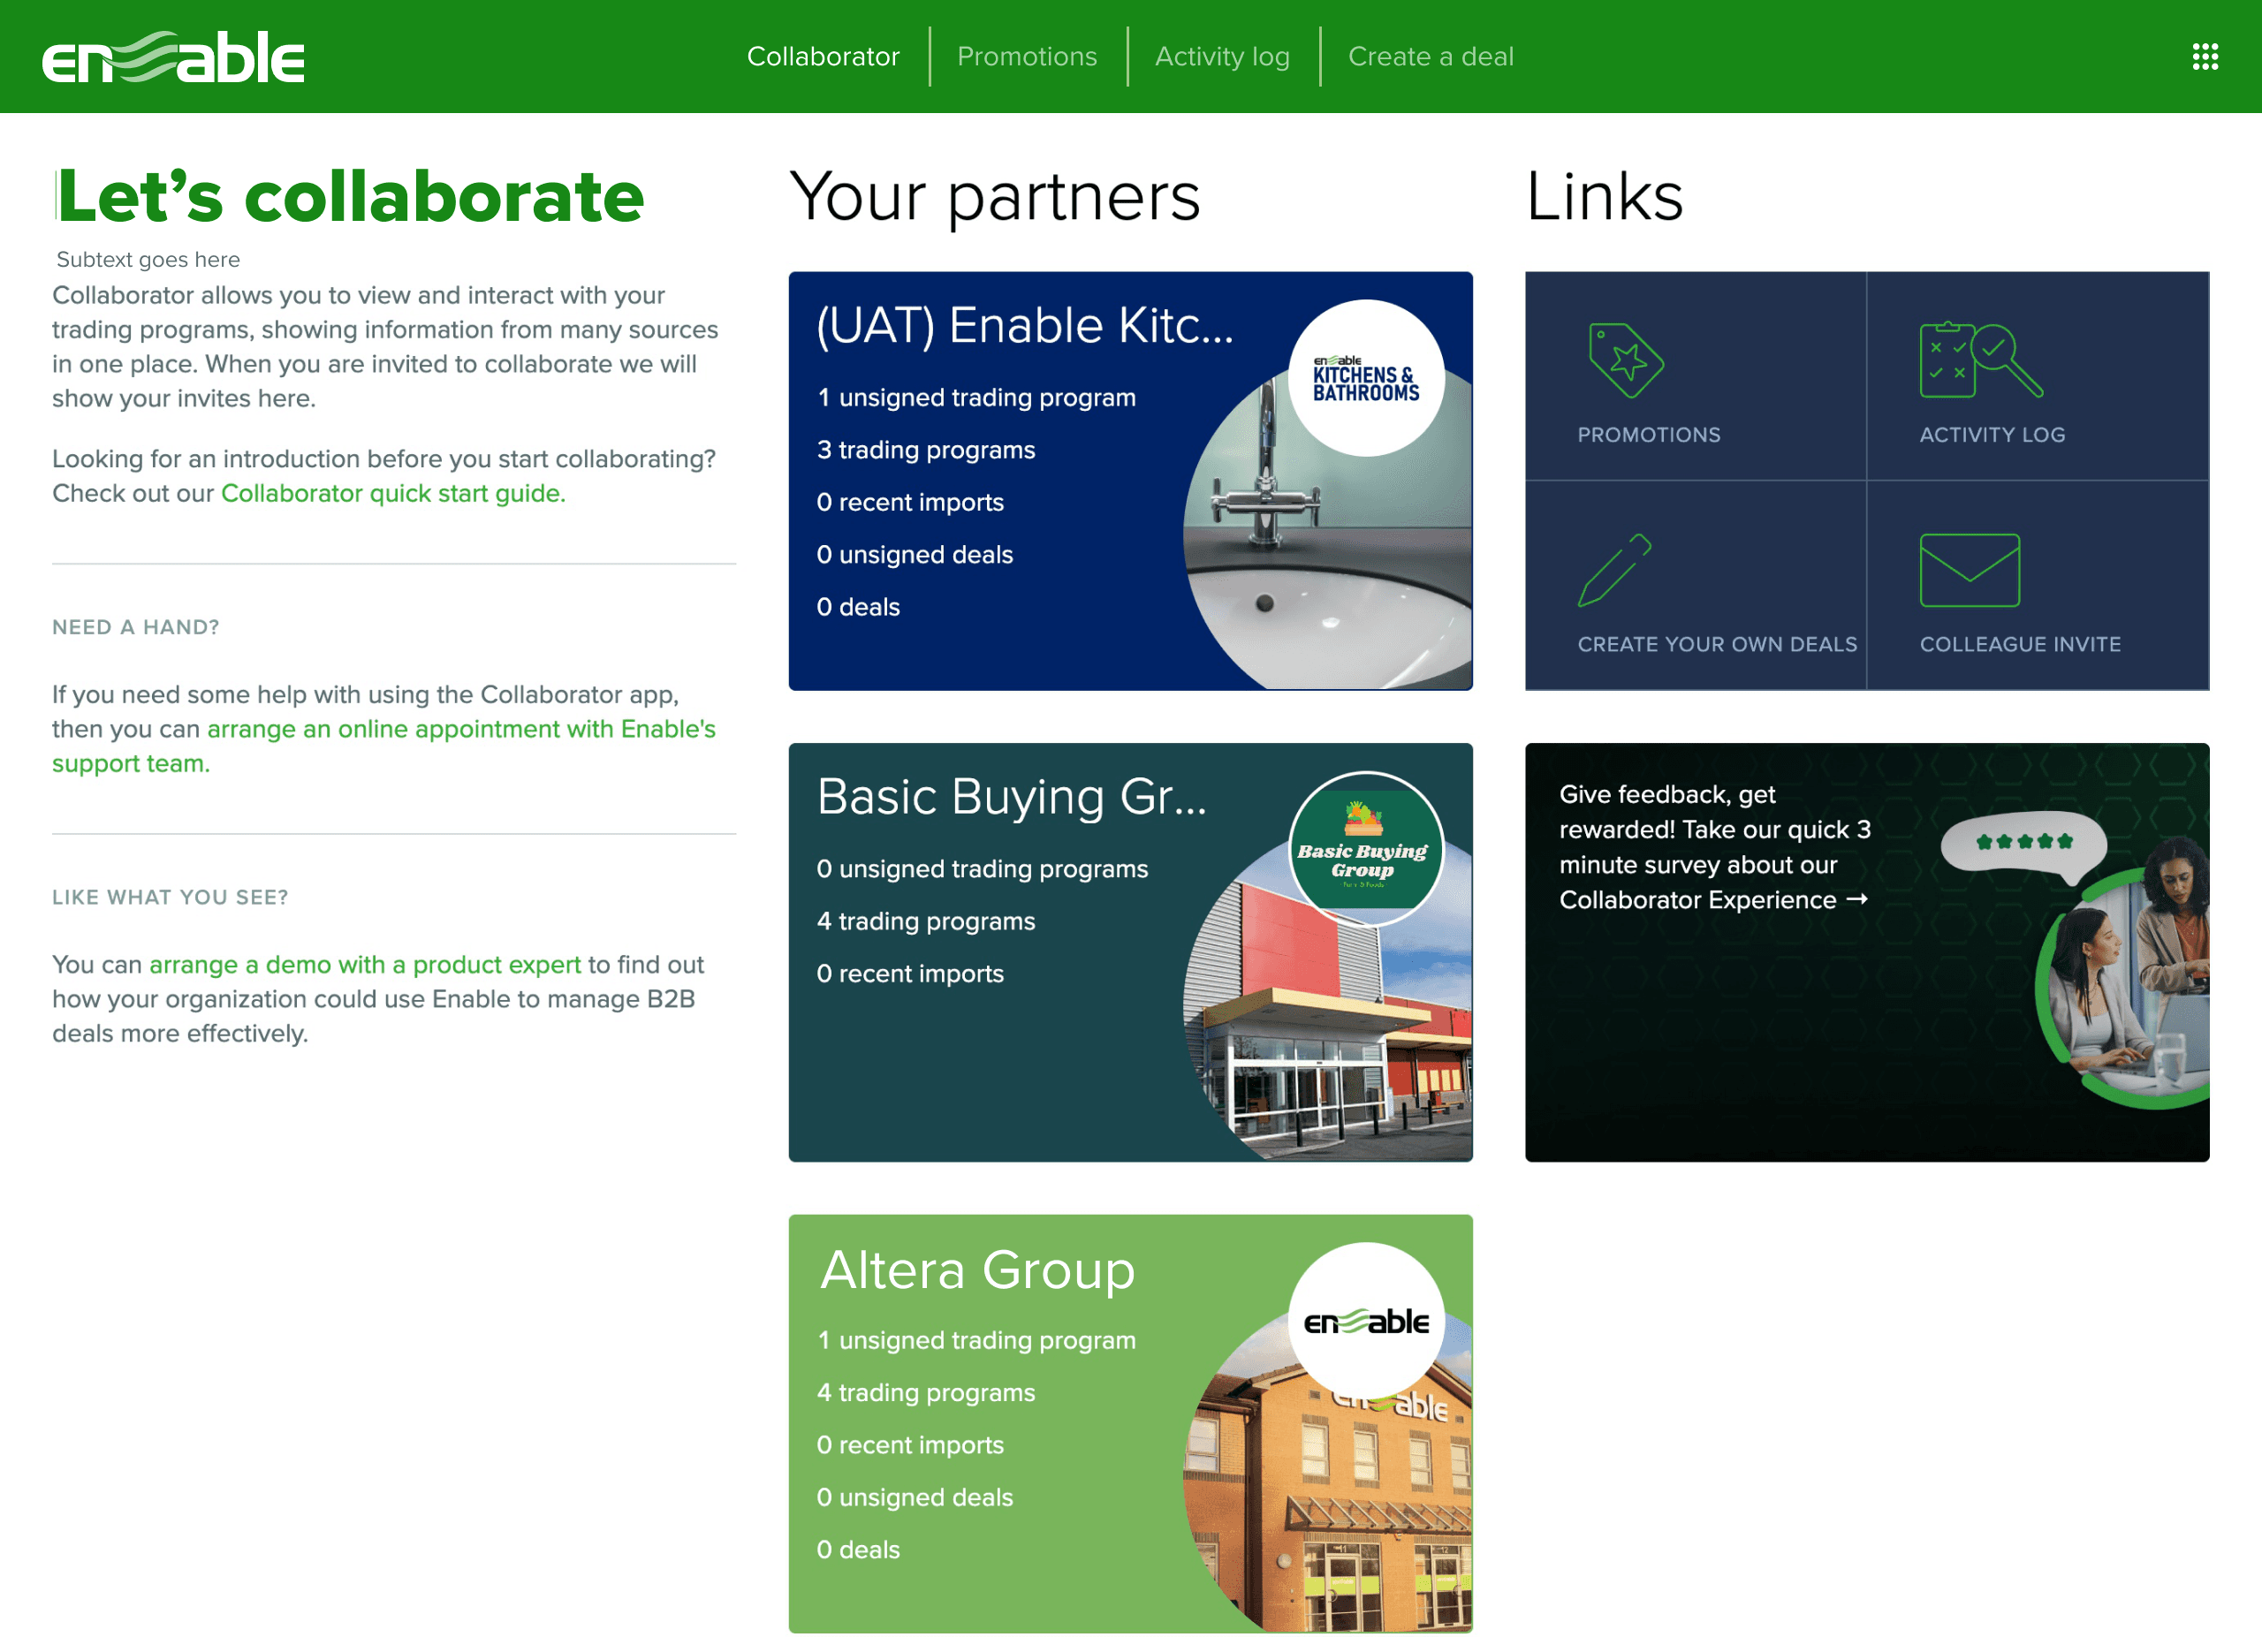
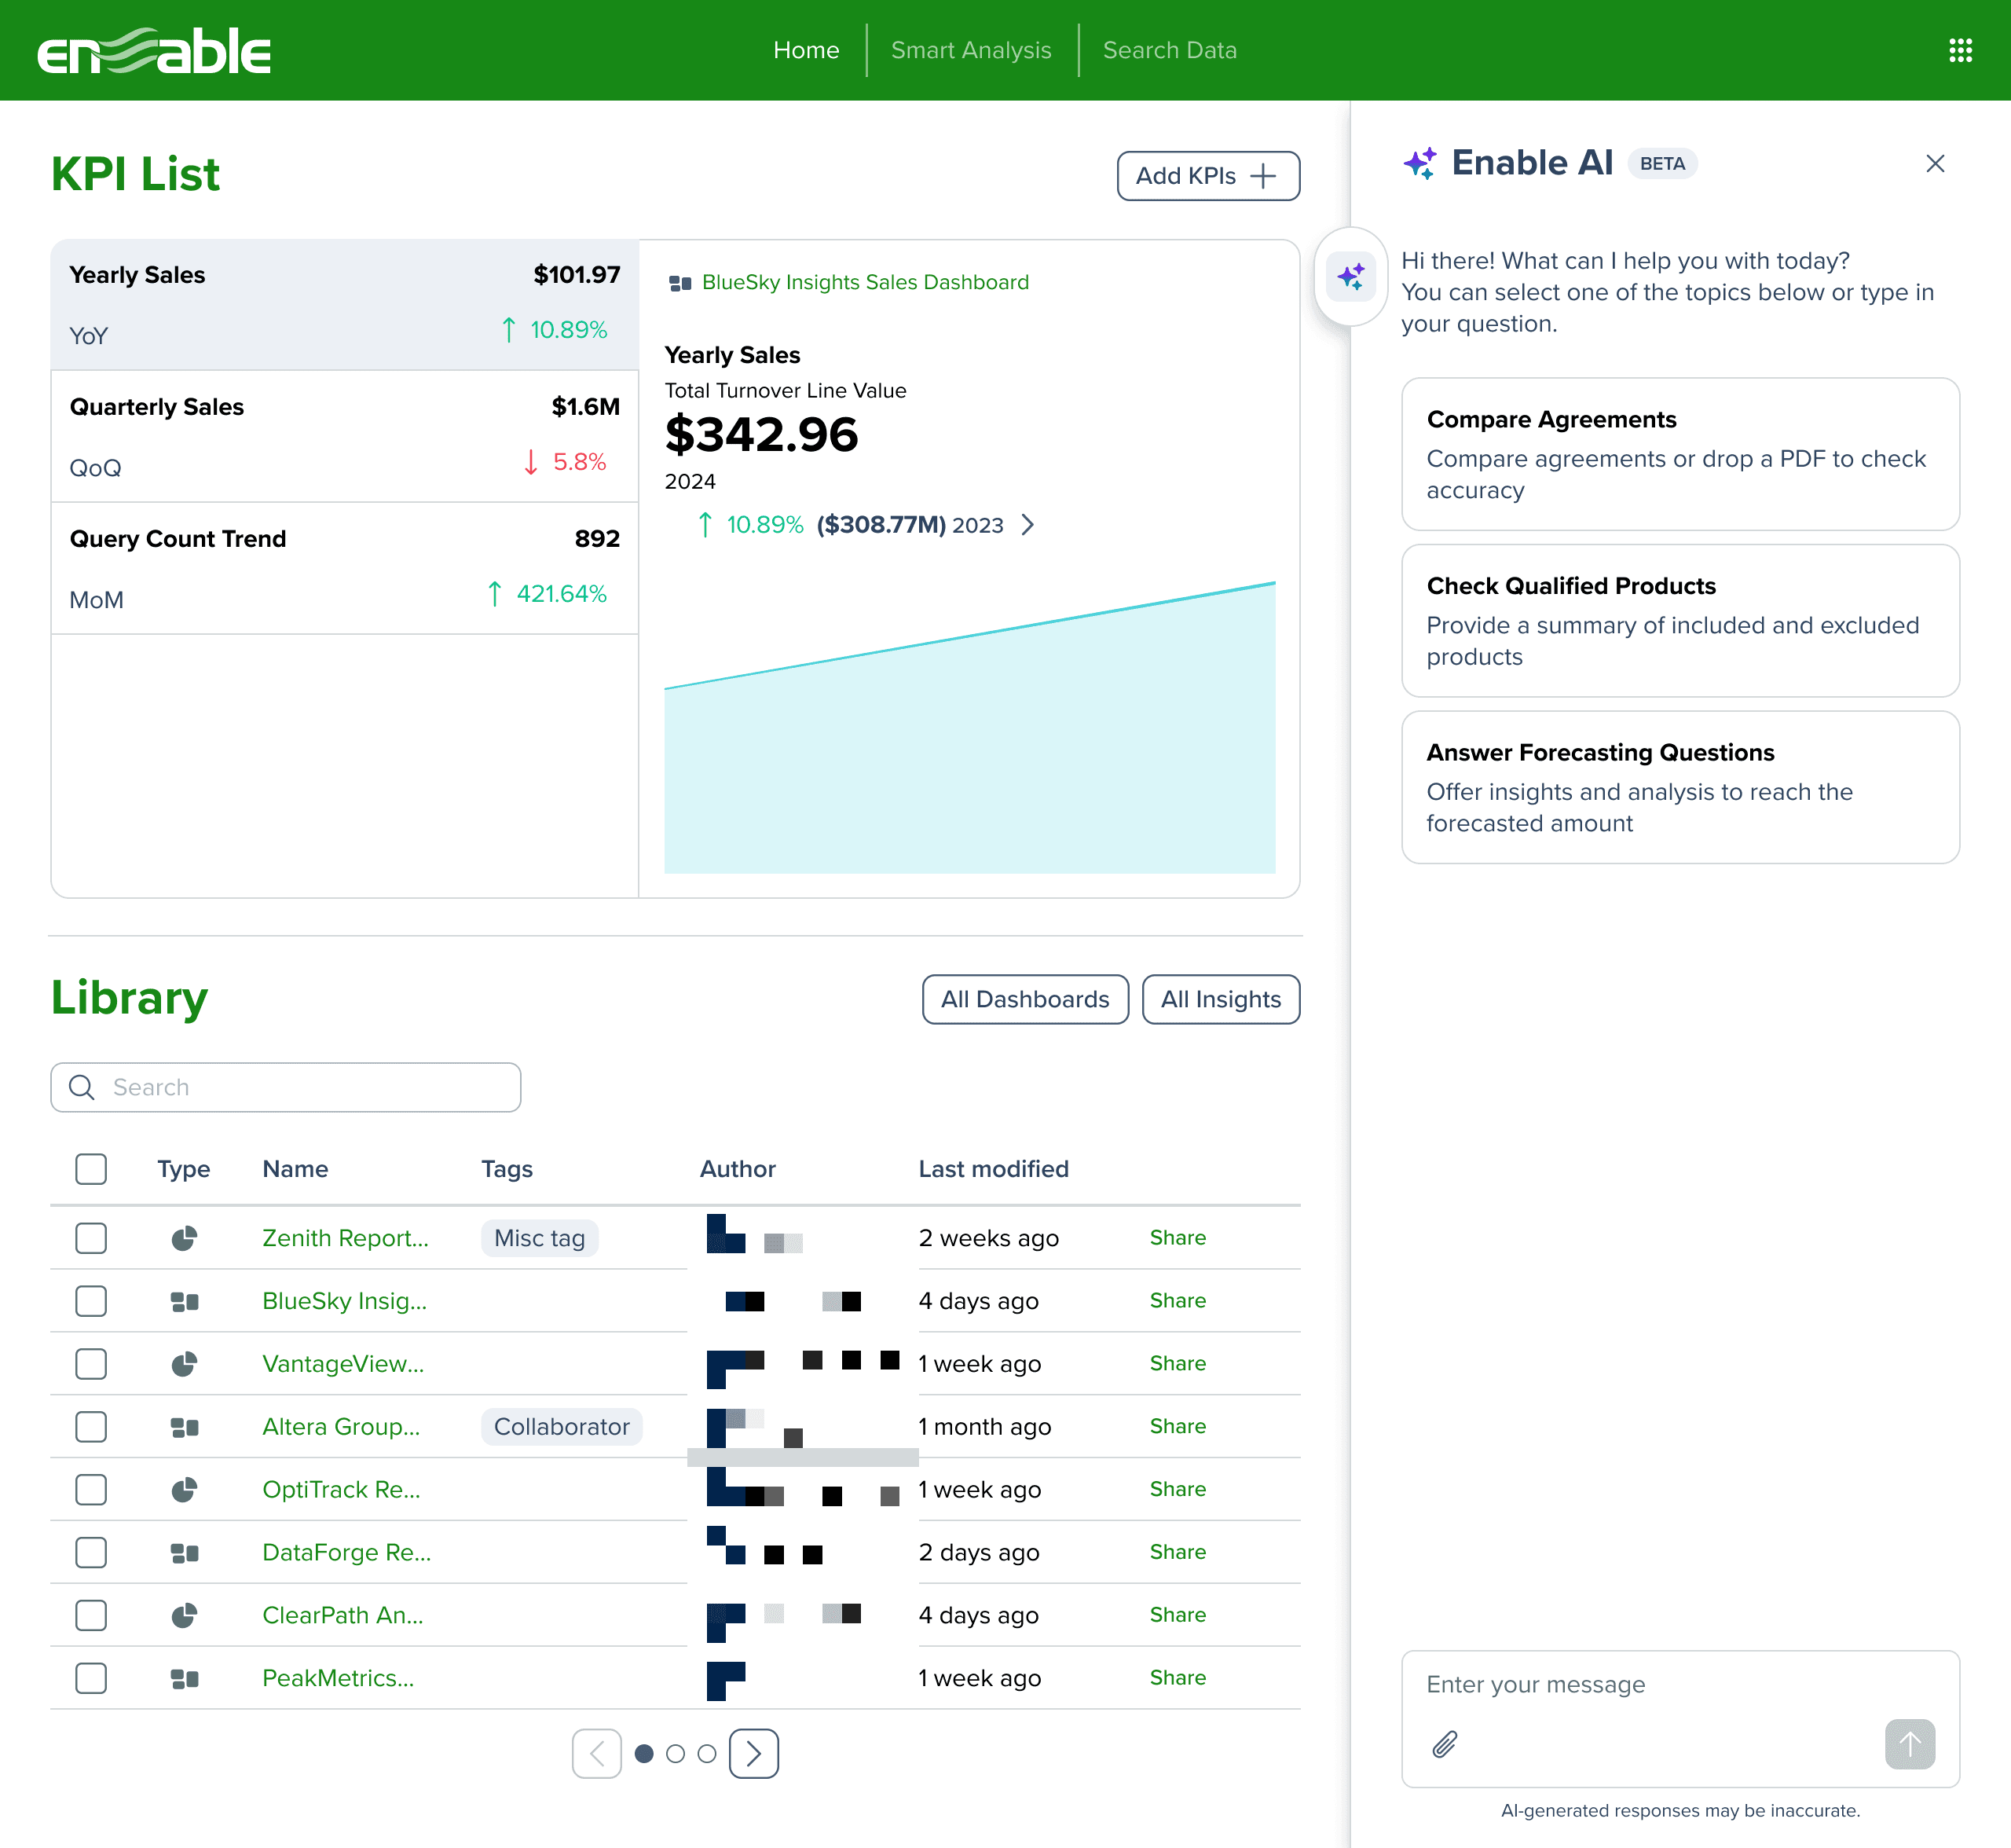
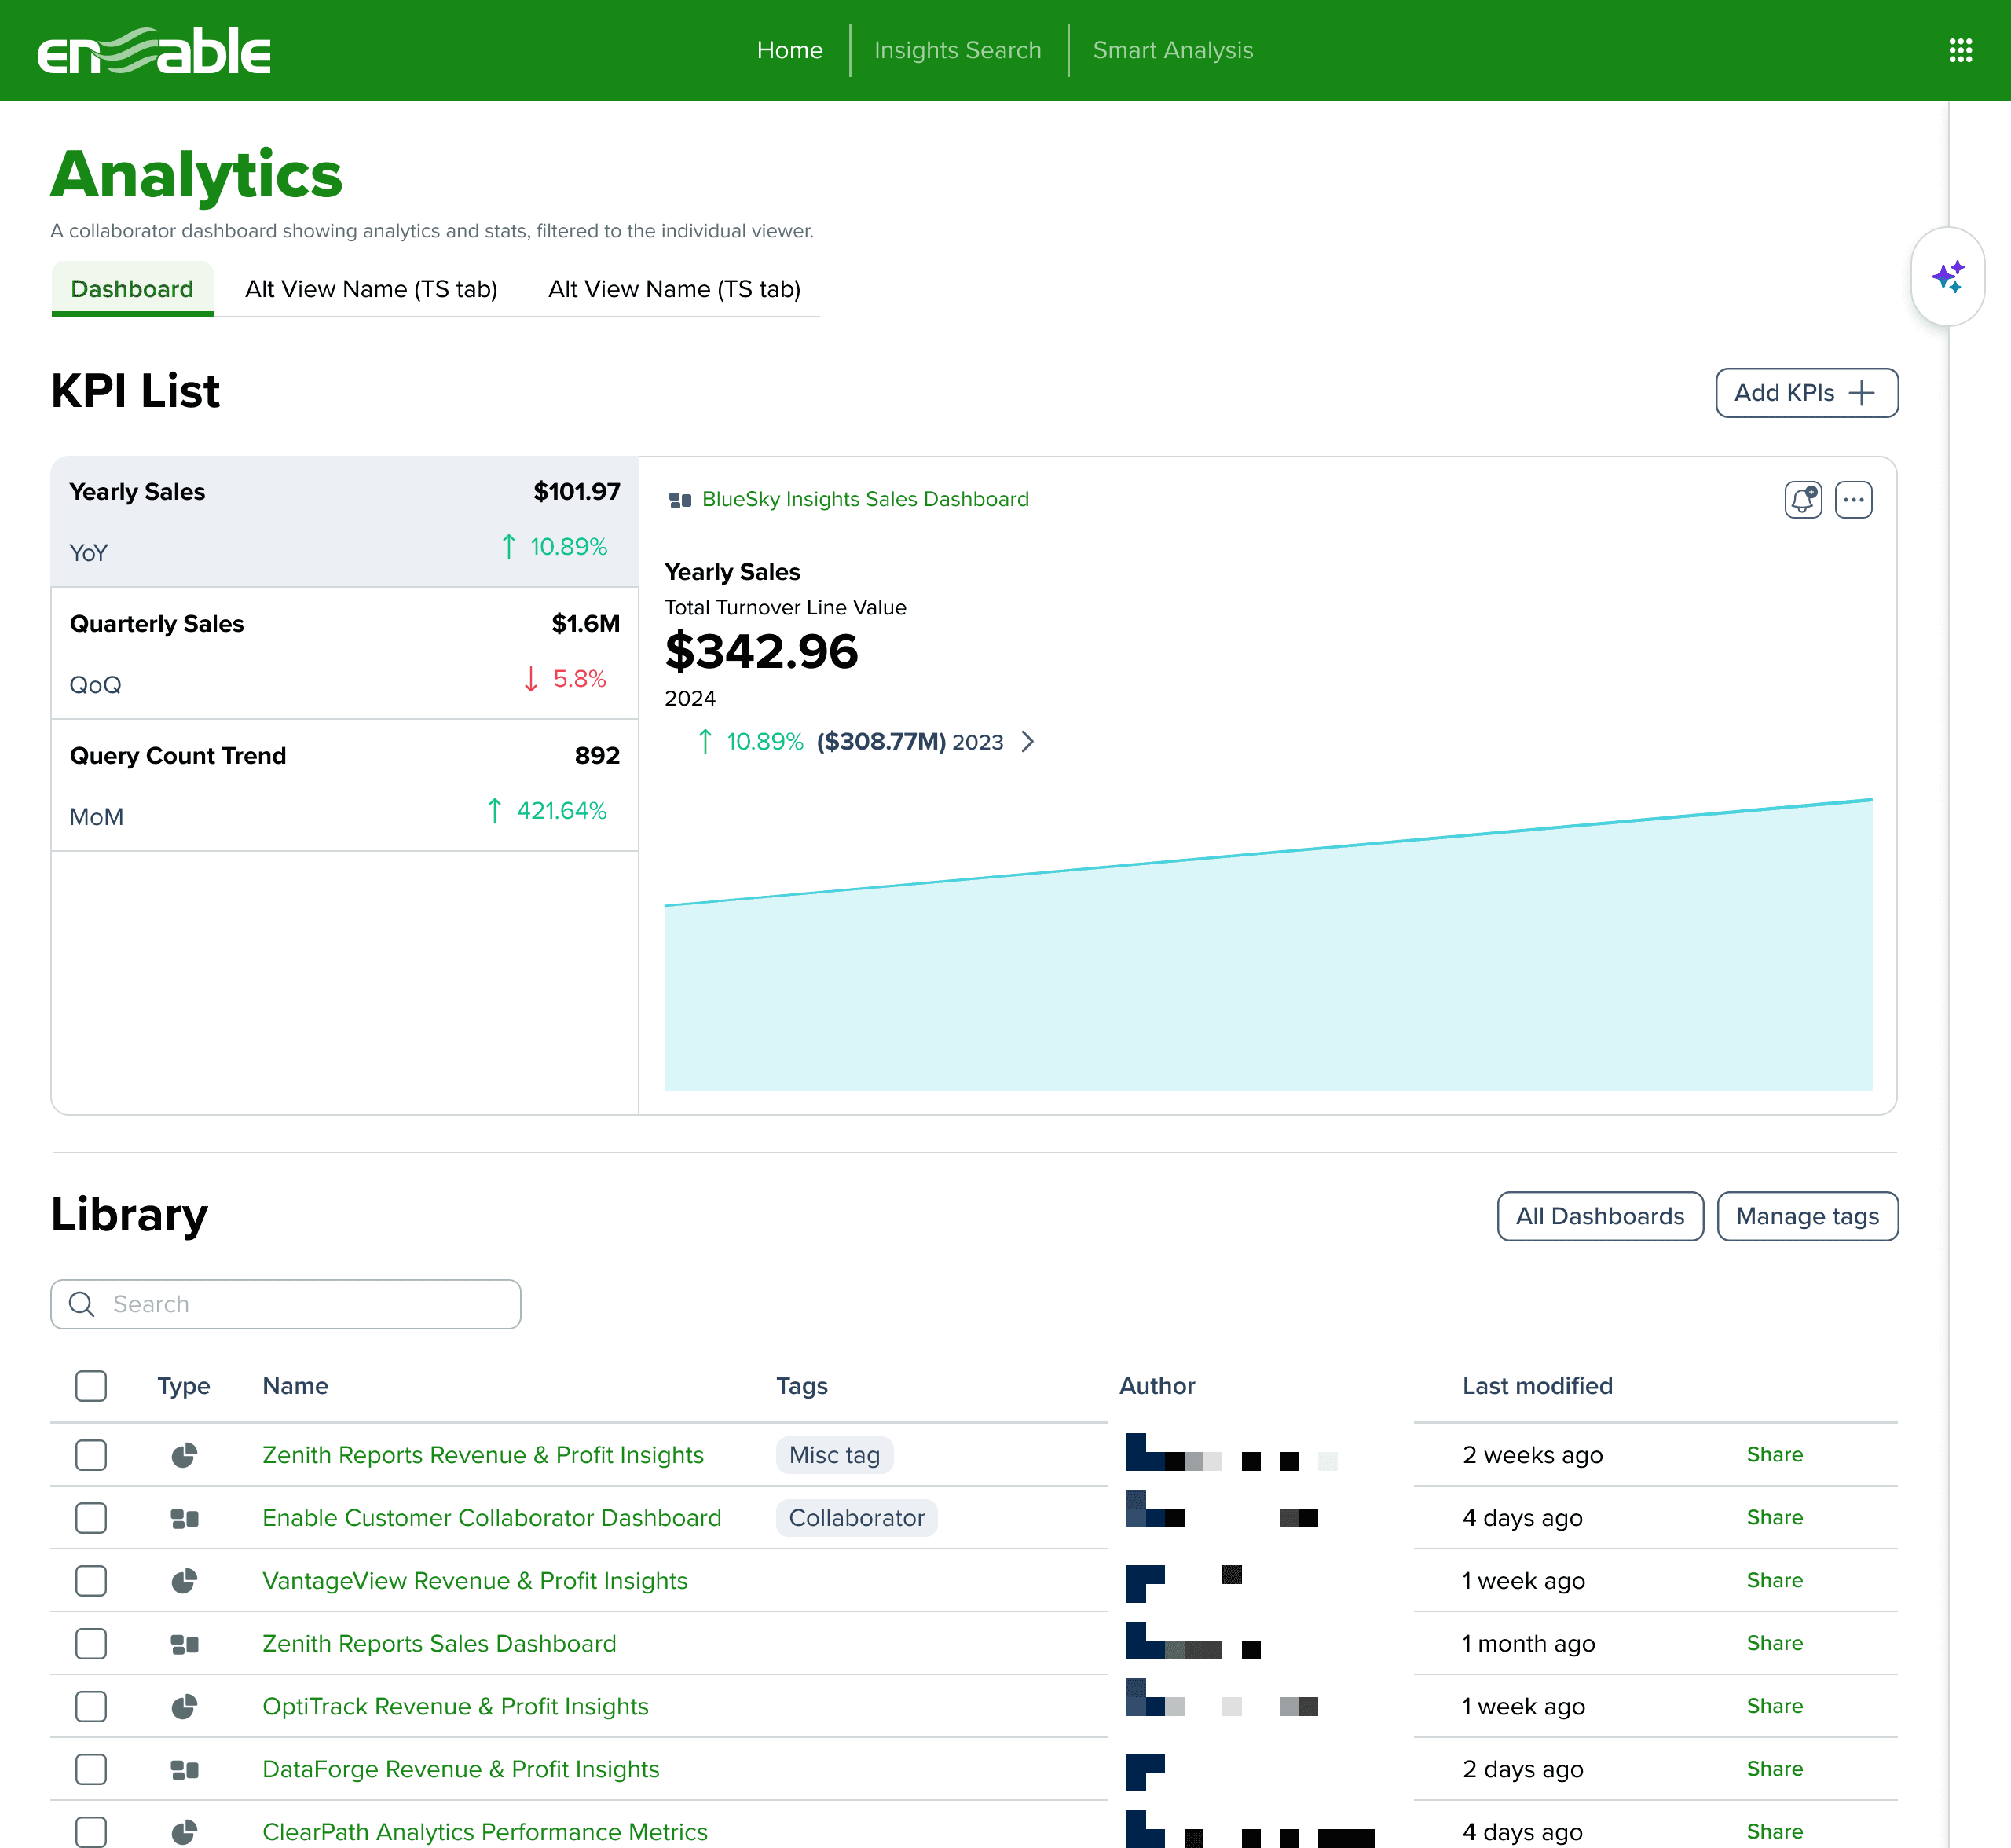
The product appears as a tile in the Collaborator Portal partners already use for agreements, no new account, no training. That is the direct answer to the “500 suppliers” quote.
80/20 out of the box.
Implementation ships an opinionated default dashboard (nine widgets, two tabs, consistent with the dashboard standards I'd published) so the first partner experience is curated, not blank.
(5)
Process: the messy middle
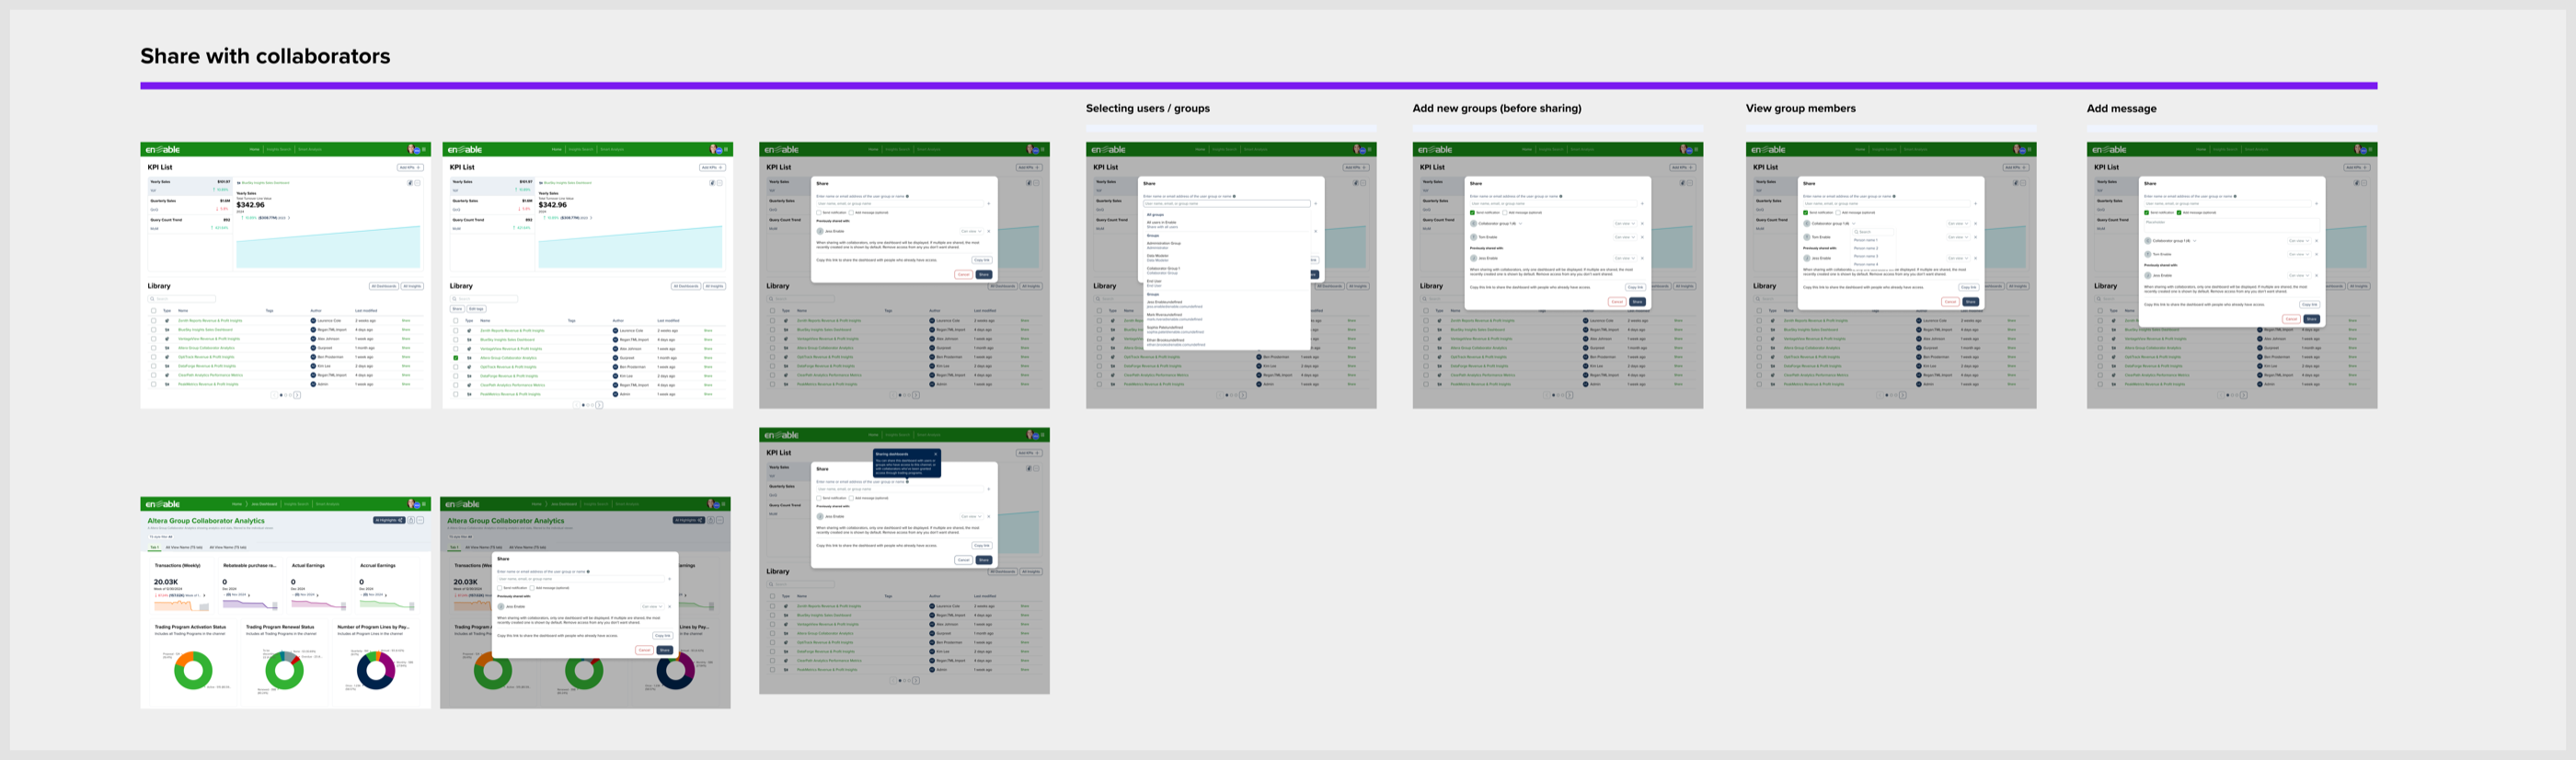
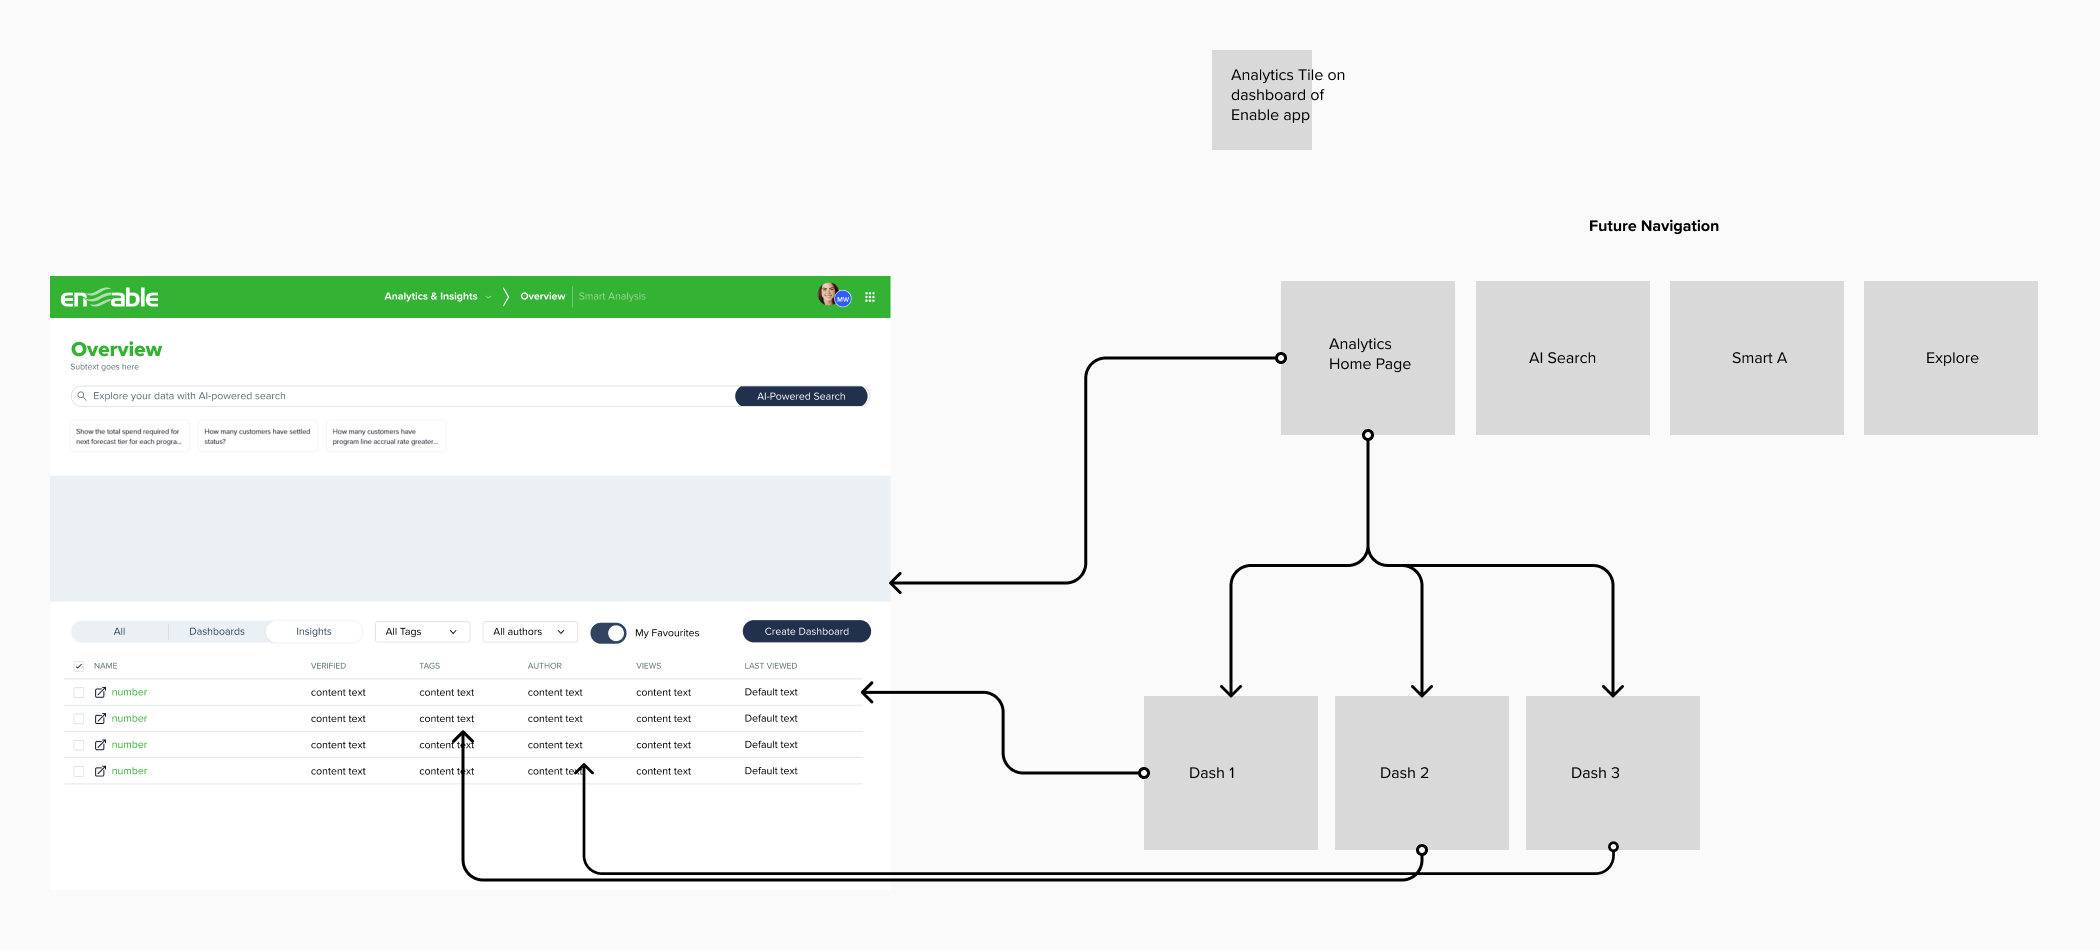
The design file tells the iteration story better than I can: six numbered versions of the Collaborator experience, a share-modal series specifying every state of the redesigned modal: empty, group-with-member-count, multi-recipient, notify-with-message, resting, plus the in-context share flow and a companion trading-partner picker, four GA2 revisions, and a hand-drawn IA sketch where the analytics home was first split into search / smart analysis / explore.
A few moments that mattered:
- My first recorded act on this product was a critique. My first dated artifact on the analytics surface (March 2025) is a spec comment on the multi-dashboard plan: “Should we phrase these as requirements from the users perspective…?”, the same spec that already contained the seed of partner sharing.
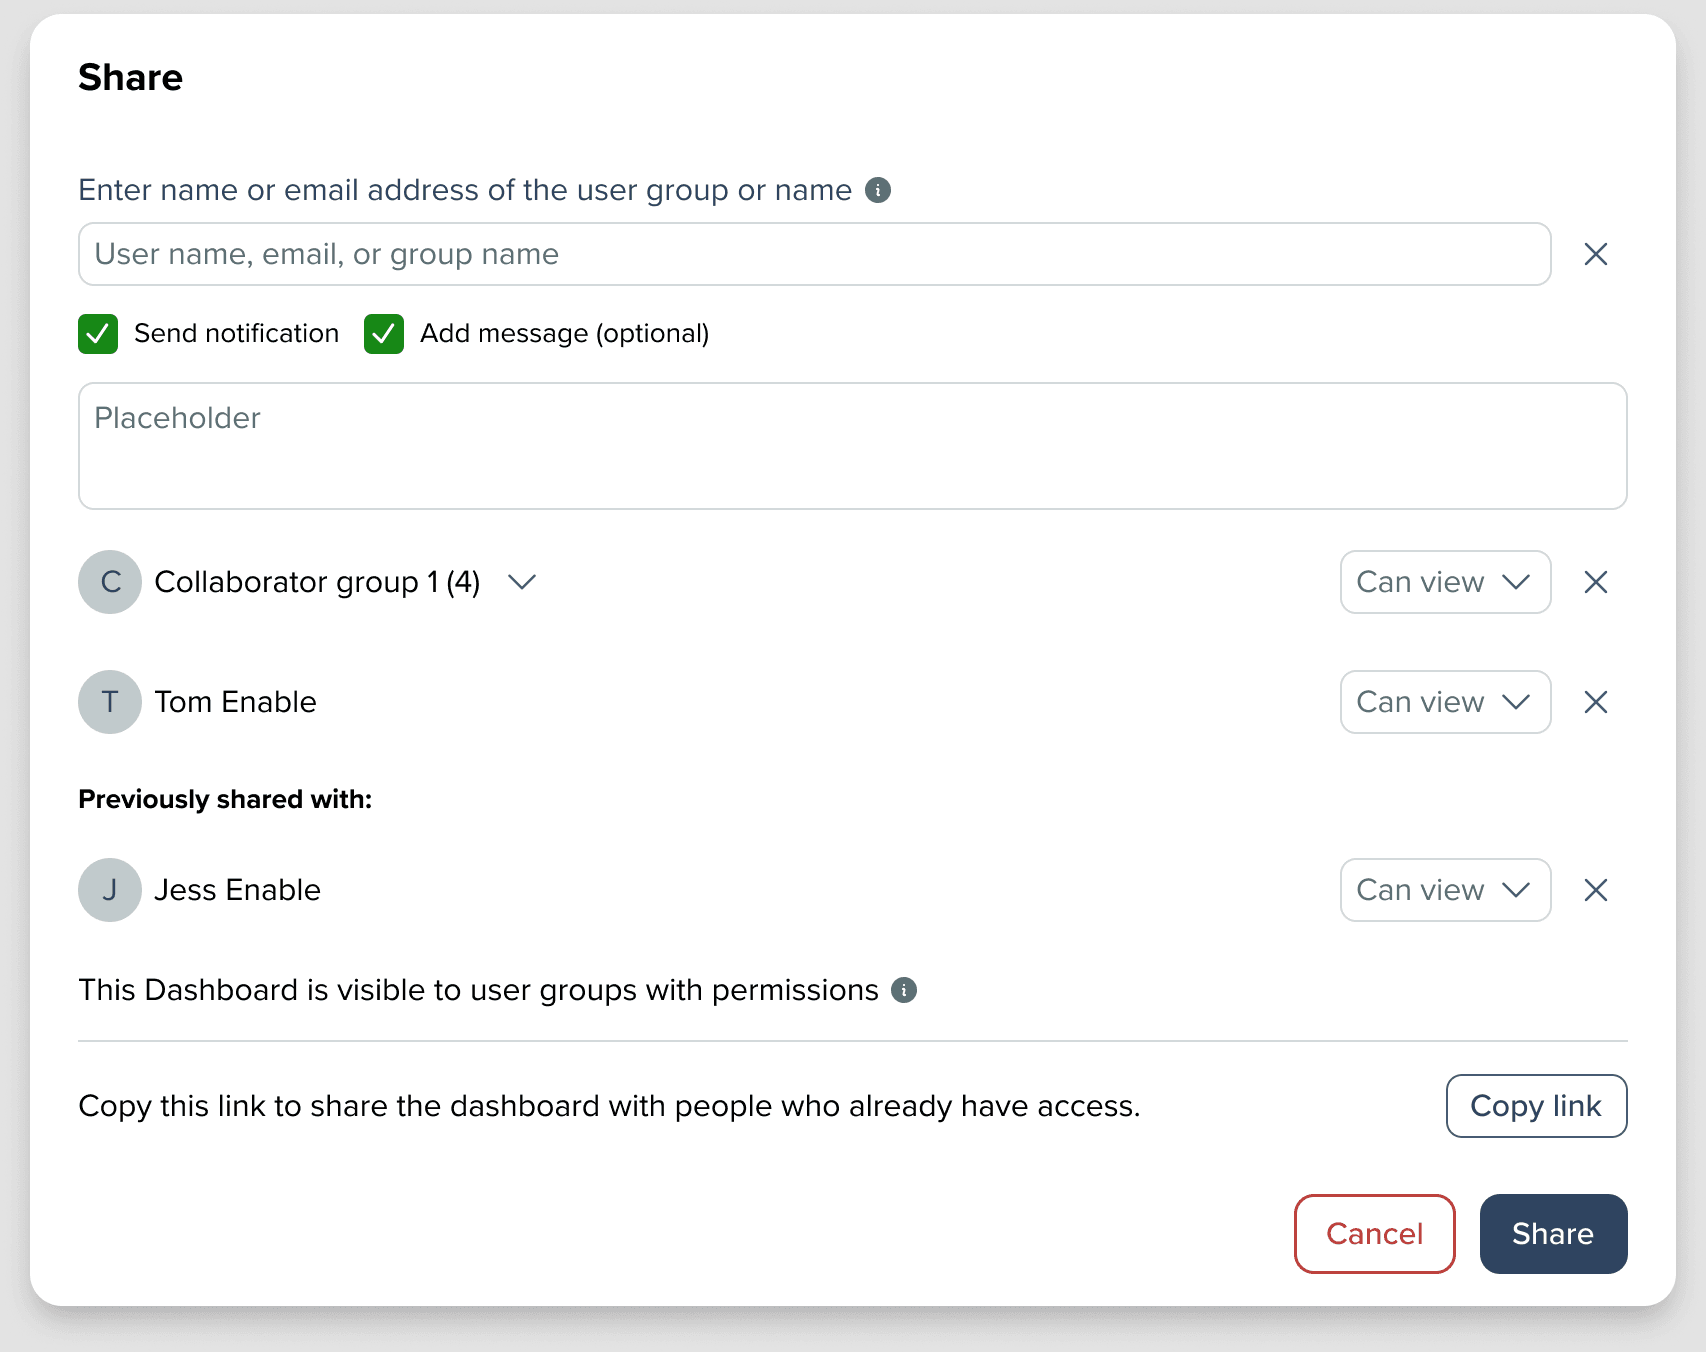
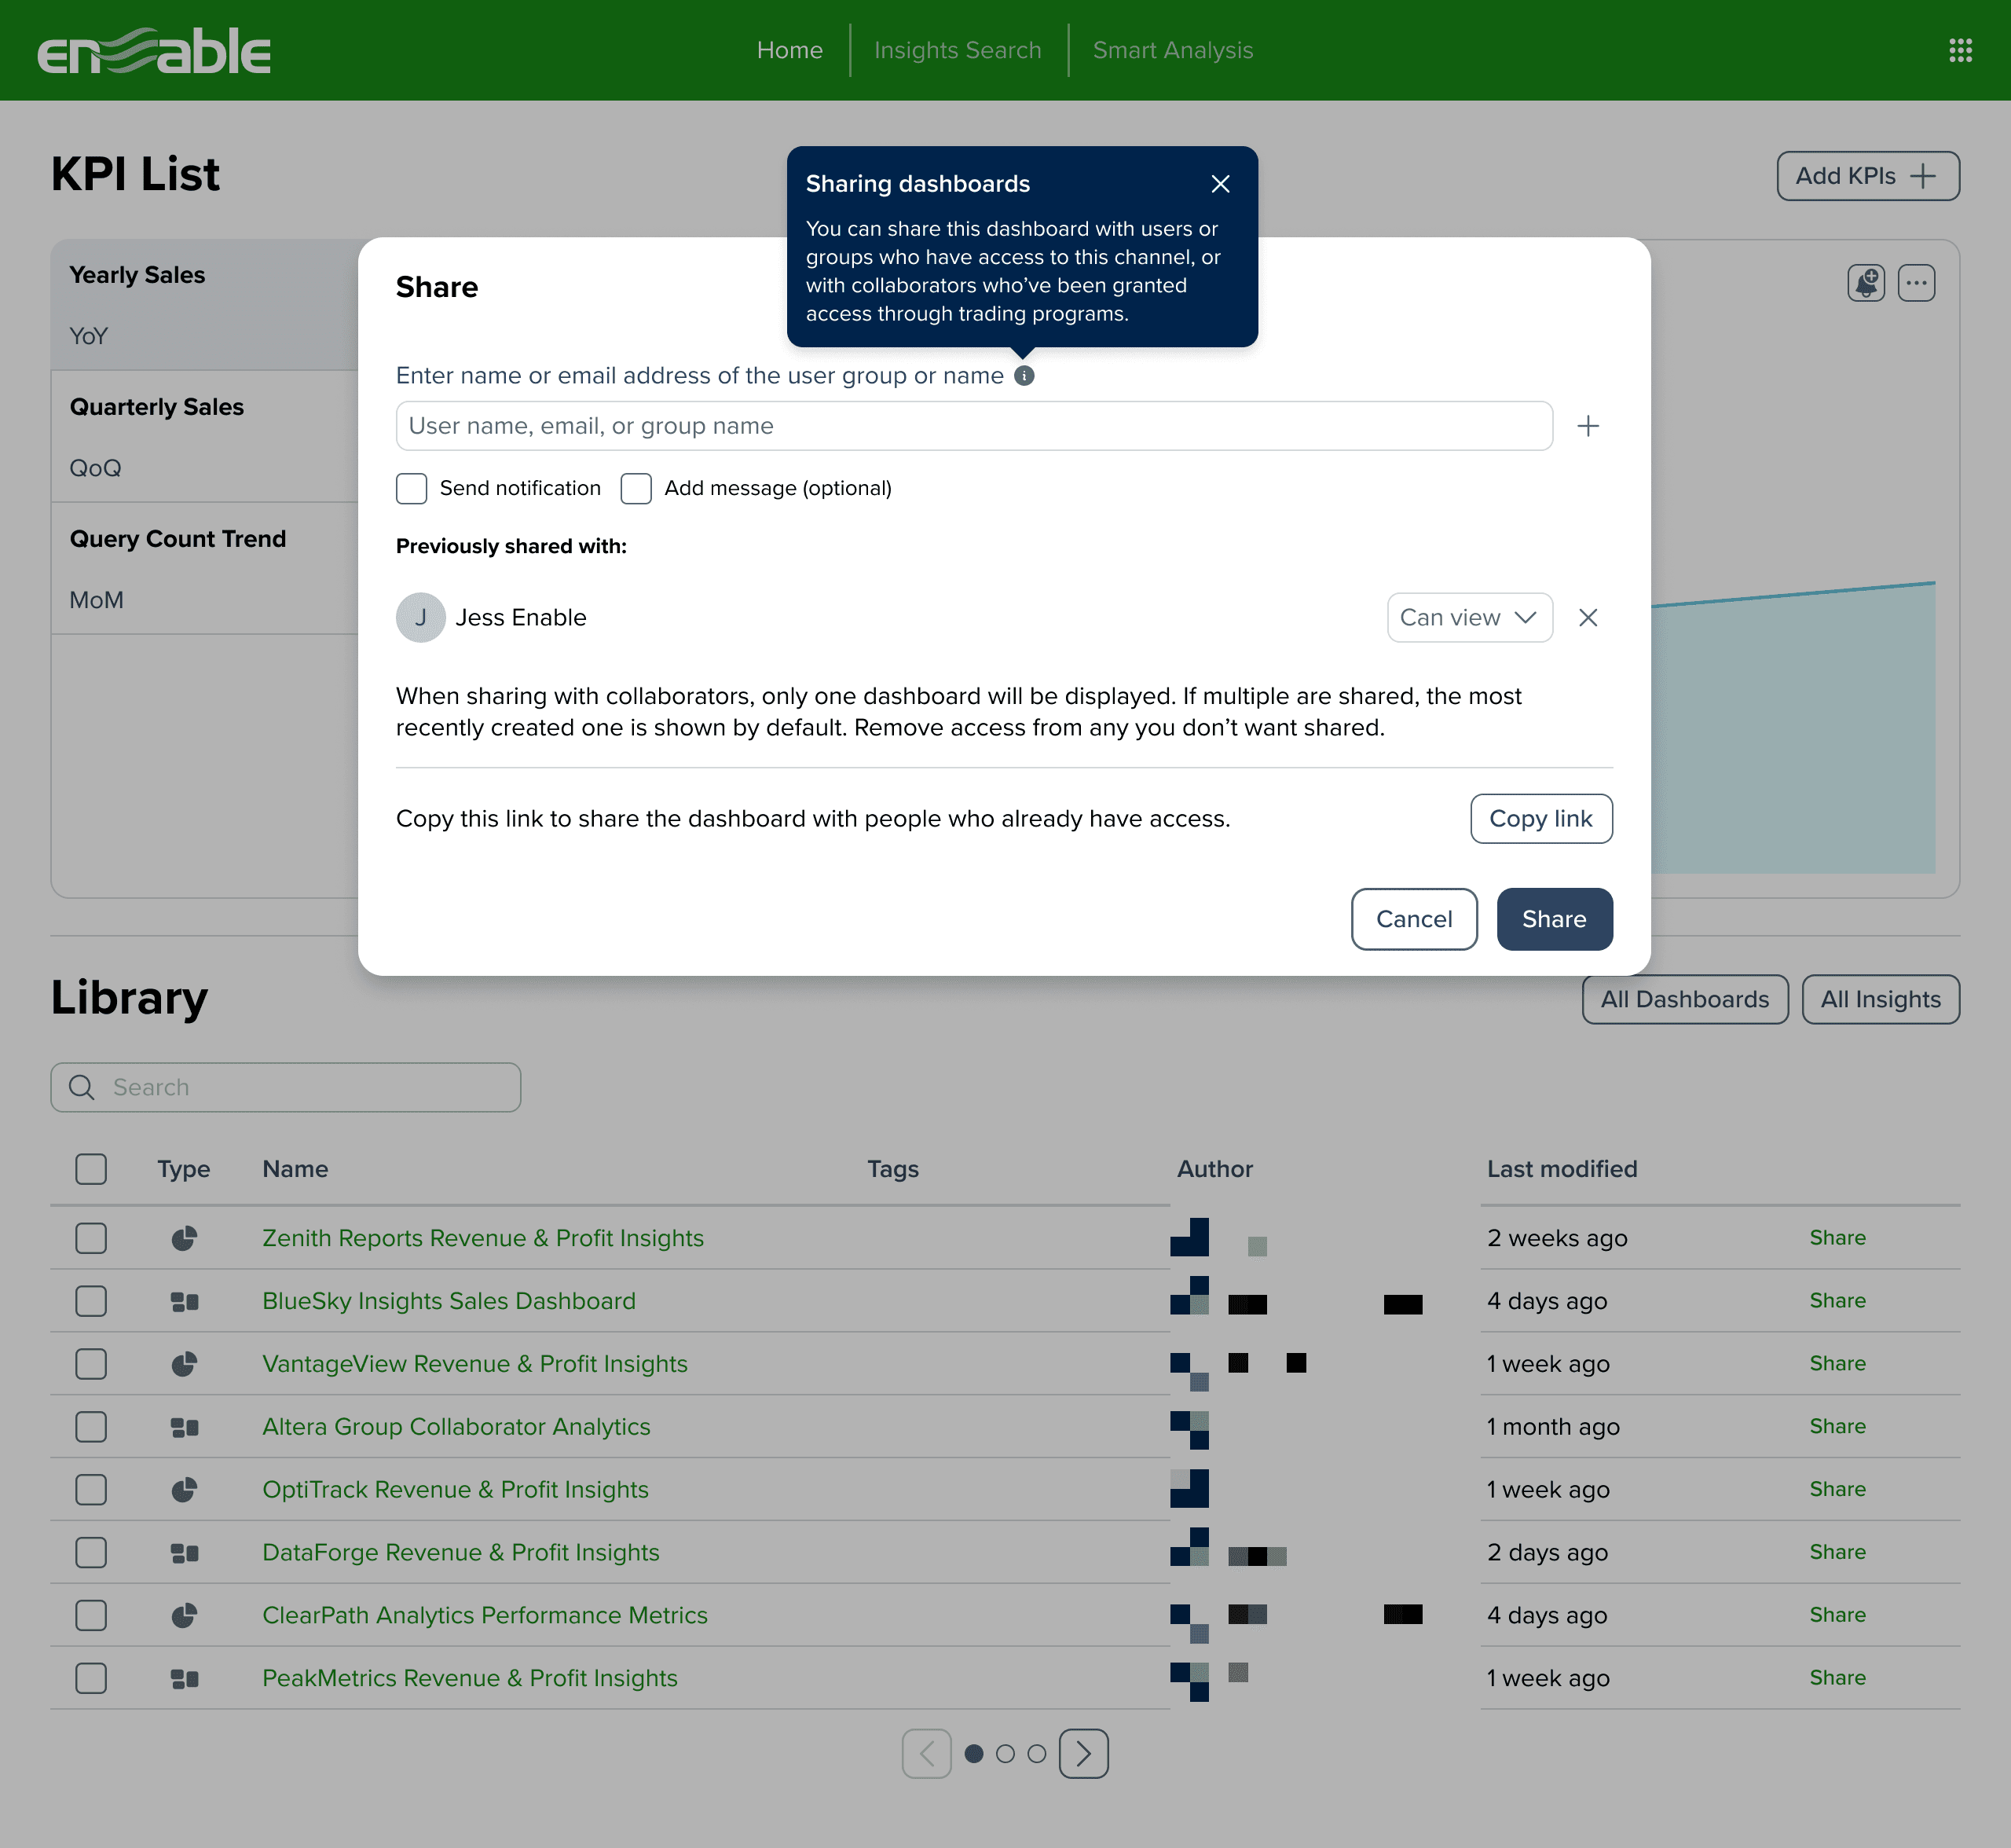
- The modal I redesigned had been deliberately gutted a year earlier. The December 2024 ticket on this surface hid ThoughtSpot's group-sharing dropdown and “Previously shared with” section with CSS, group sharing meant nothing before partners existed in the product. Partner Analytics made groups the whole point, so my redesign reinstated exactly what had been hidden: collaborator groups with visible member counts, per-row access control, and notification options.
- The preview-fidelity question. When early-release scope was being cut, I pushed on what previewing as a collaborator actually meant: would the customer see the partner's actual limited view, or just filtered visualizations? The distinction decides whether customers can trust what they're about to share.
- Killing a feature politely. Engineering routed two vendor-feature design reviews through me in August 2025. On ThoughtSpot's “knowledge cards”, hover explanations on AI-answer tokens, I found the same token showed different content in the edit window than on the answer card, and wrote on the ticket: “I'm not sure how helpful the text is so far… It creates more confusion than value… my recommendation would be to keep these hidden.” The PM agreed, and the eng lead opened the removal ticket citing my comment, “happy to agree with your assessment”, with removal verified in production within three weeks. The companion review went the other way (keep it, restyle it, add telemetry): the bar was user value, not reflexive distrust of vendor features.
- The copy compromise happened without me. The final share-modal copy call landed while I was on leave in January 2026, the PM chose the pragmatic phrasing within the string-ID constraint, building on the options I'd left documented. I think that's worth stating plainly rather than absorbing into “I shipped the modal.”

(6)
The Solution
The shipped experience, walked end-to-end:
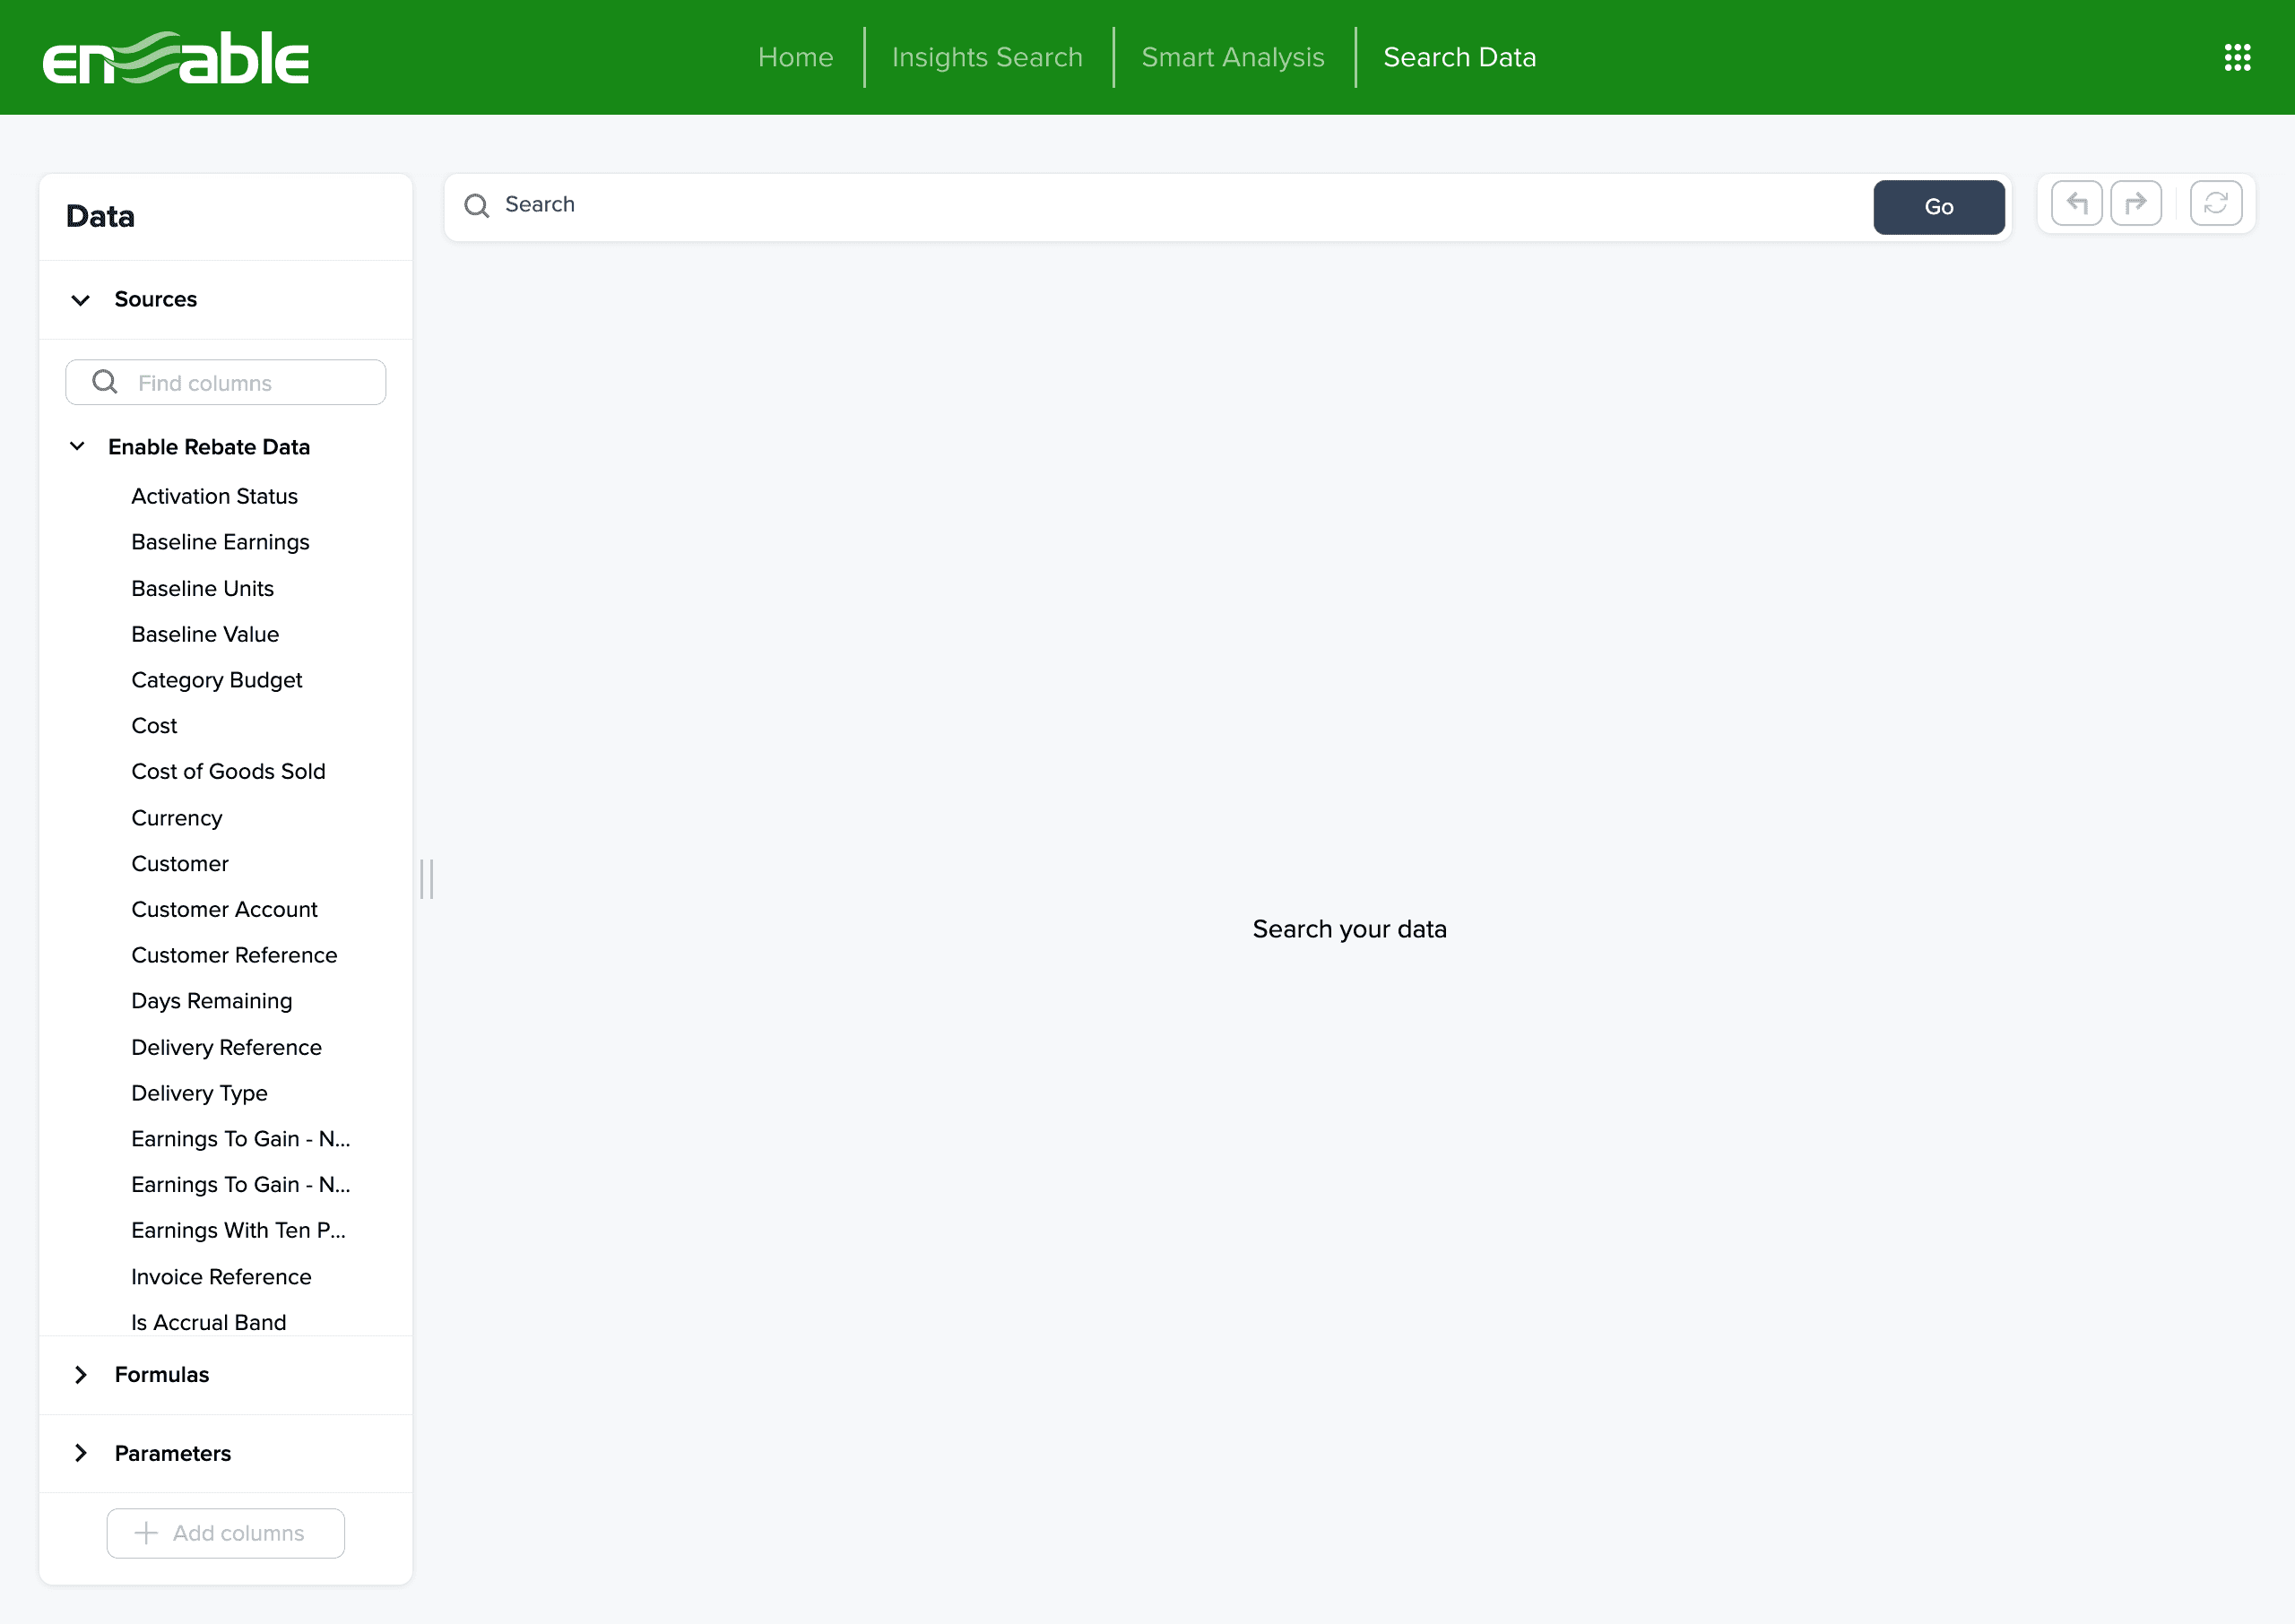
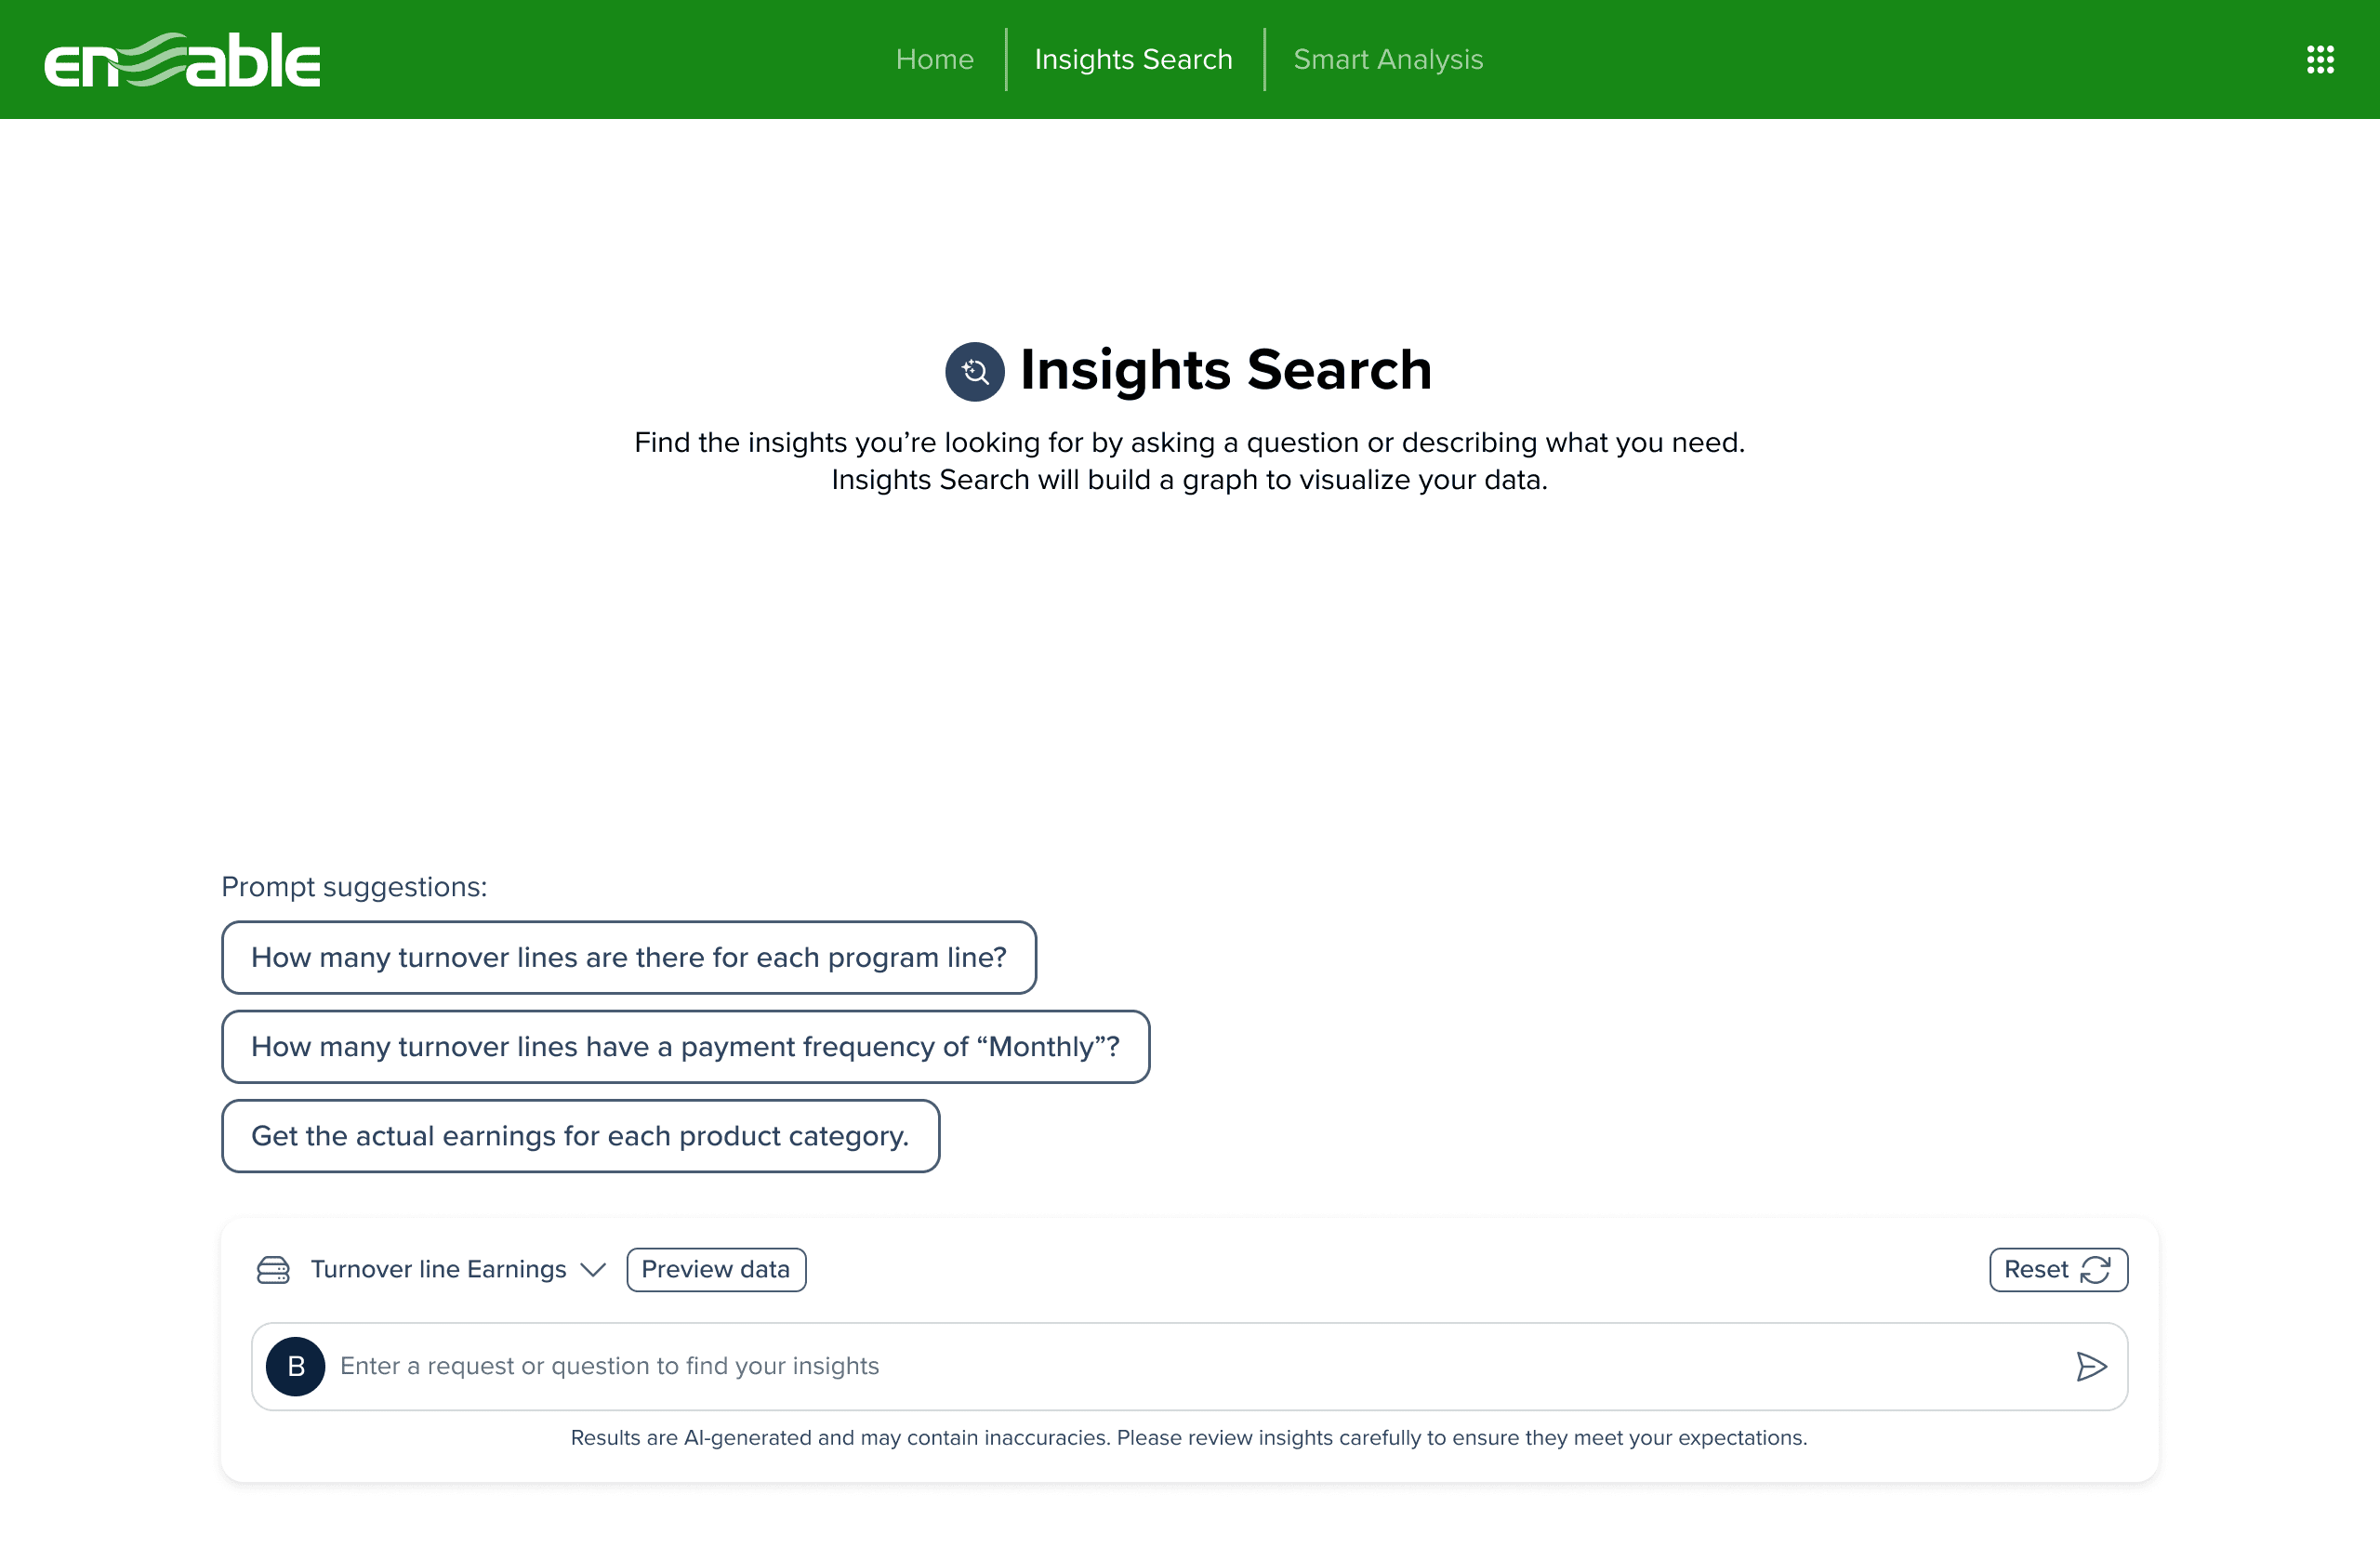
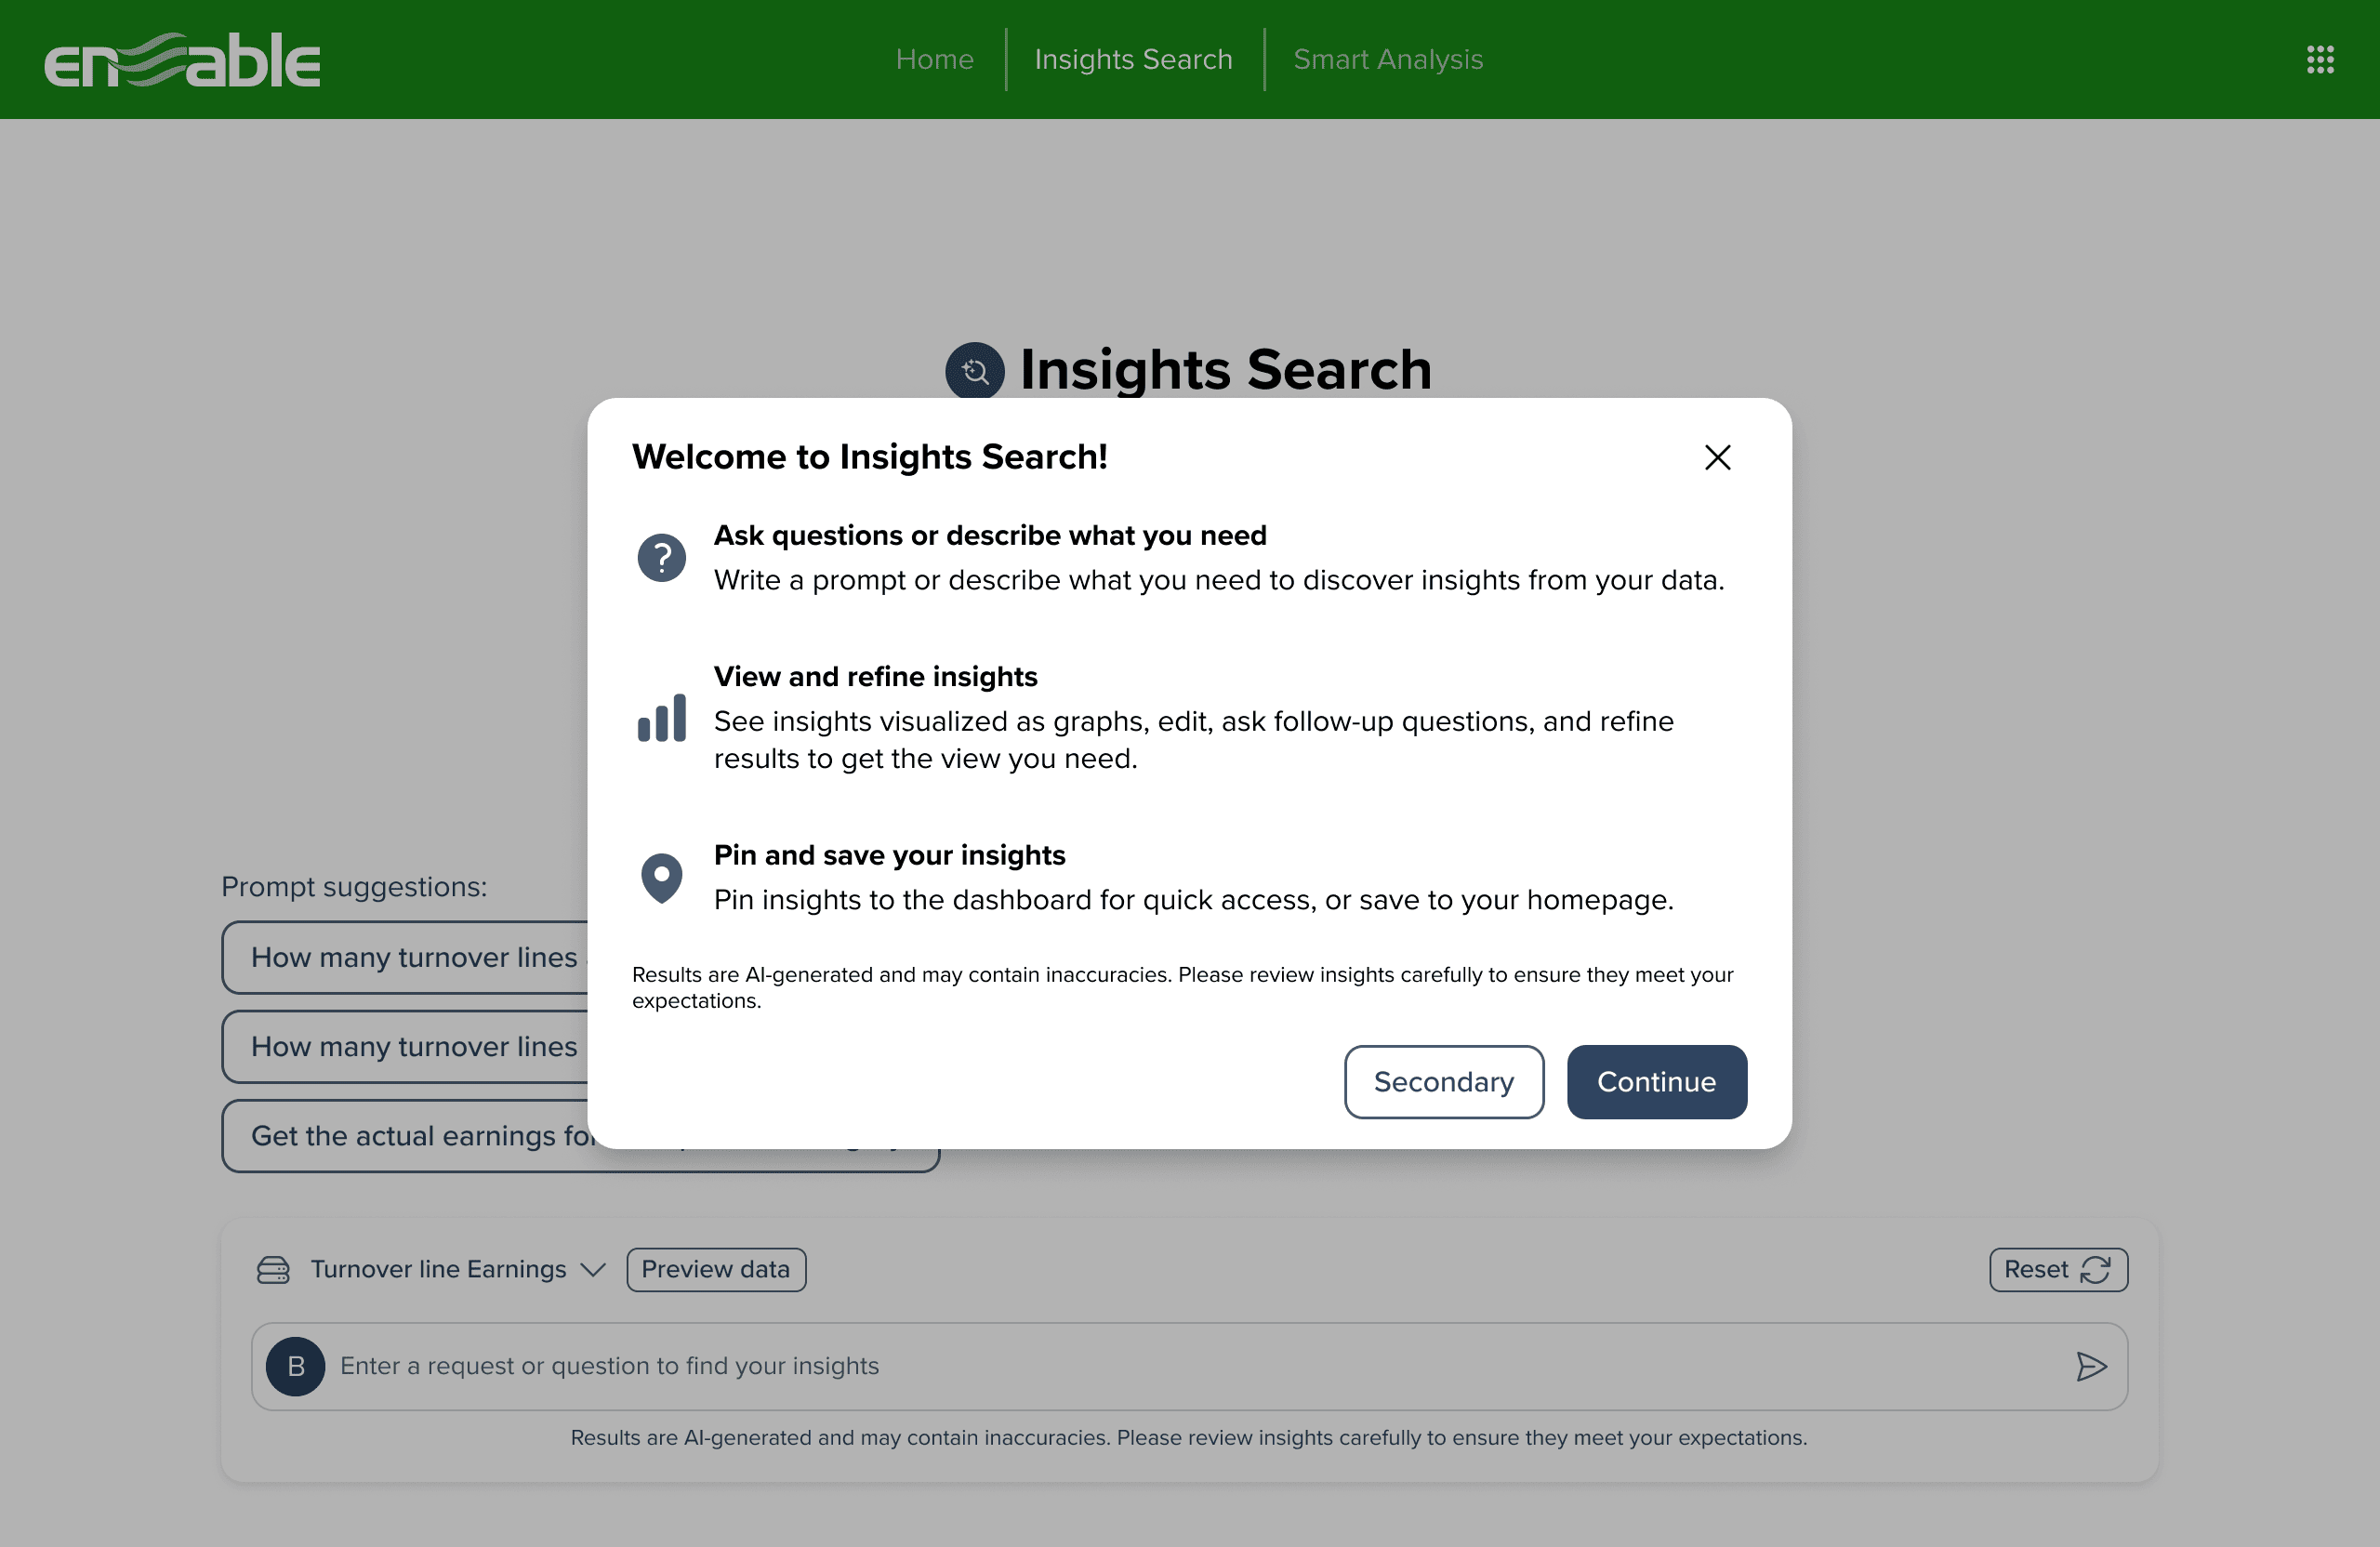
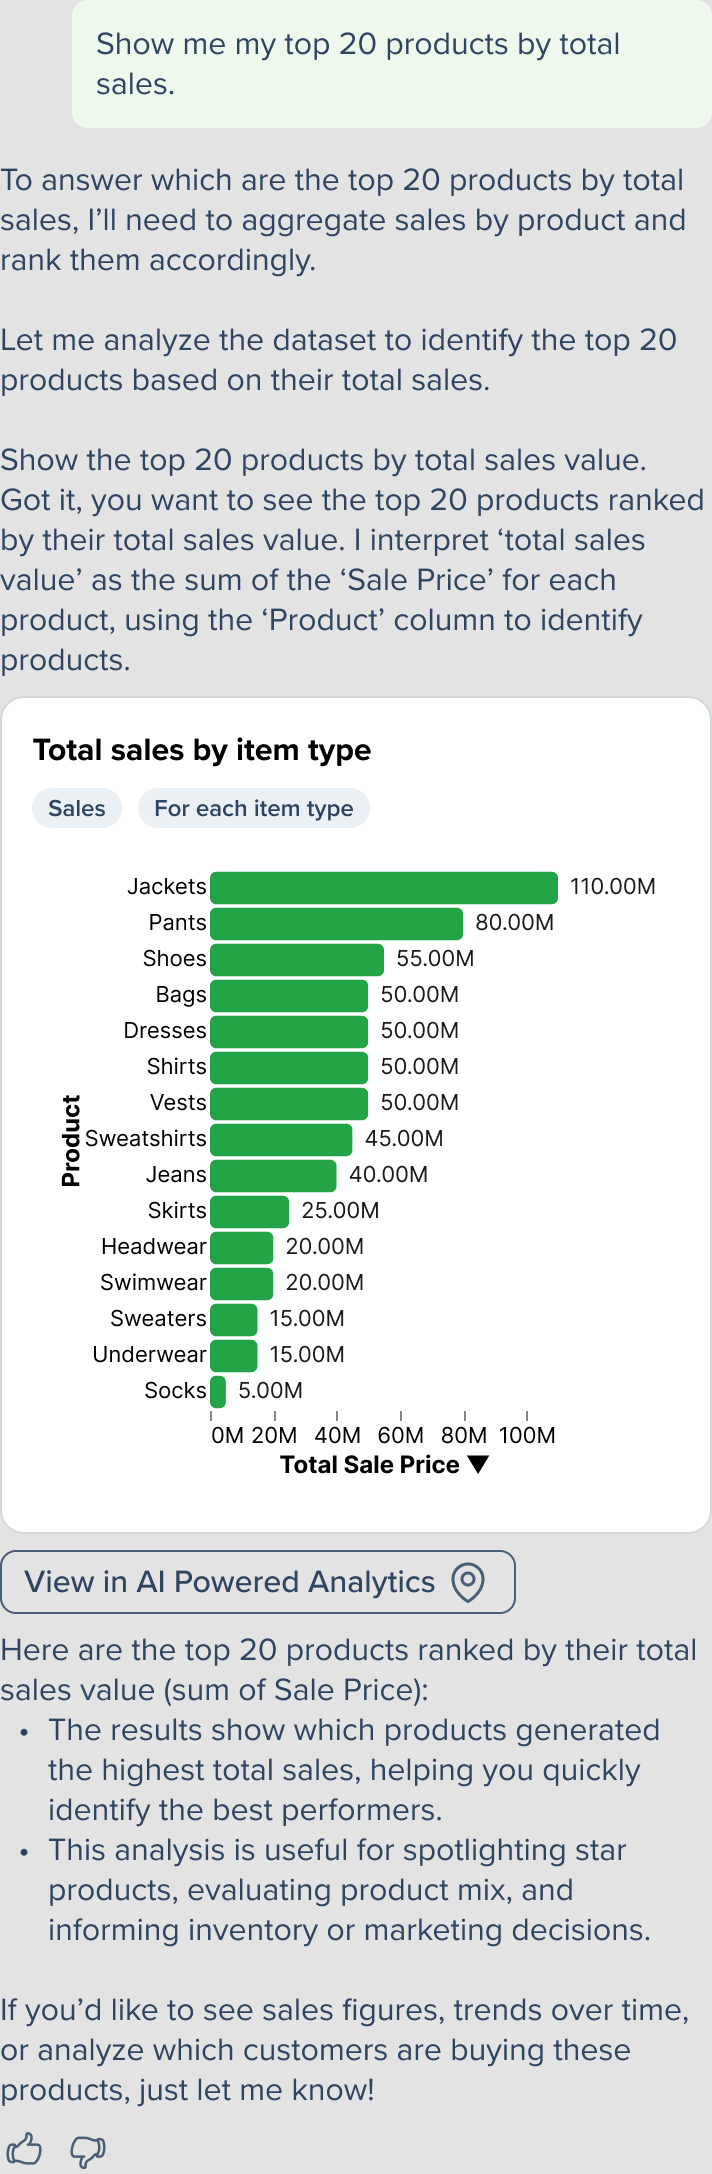
Analyst side (AI-Powered Analytics). An analyst explores governed rebate data, dashboards, drilldowns, and Insights Search, the natural-language surface I redesigned across GA2: prompt suggestions grounded in the customer's own model, a first-run welcome modal that sets expectations for what the AI can and can't do, and answer surfaces that are charts with sources, never prose claims.
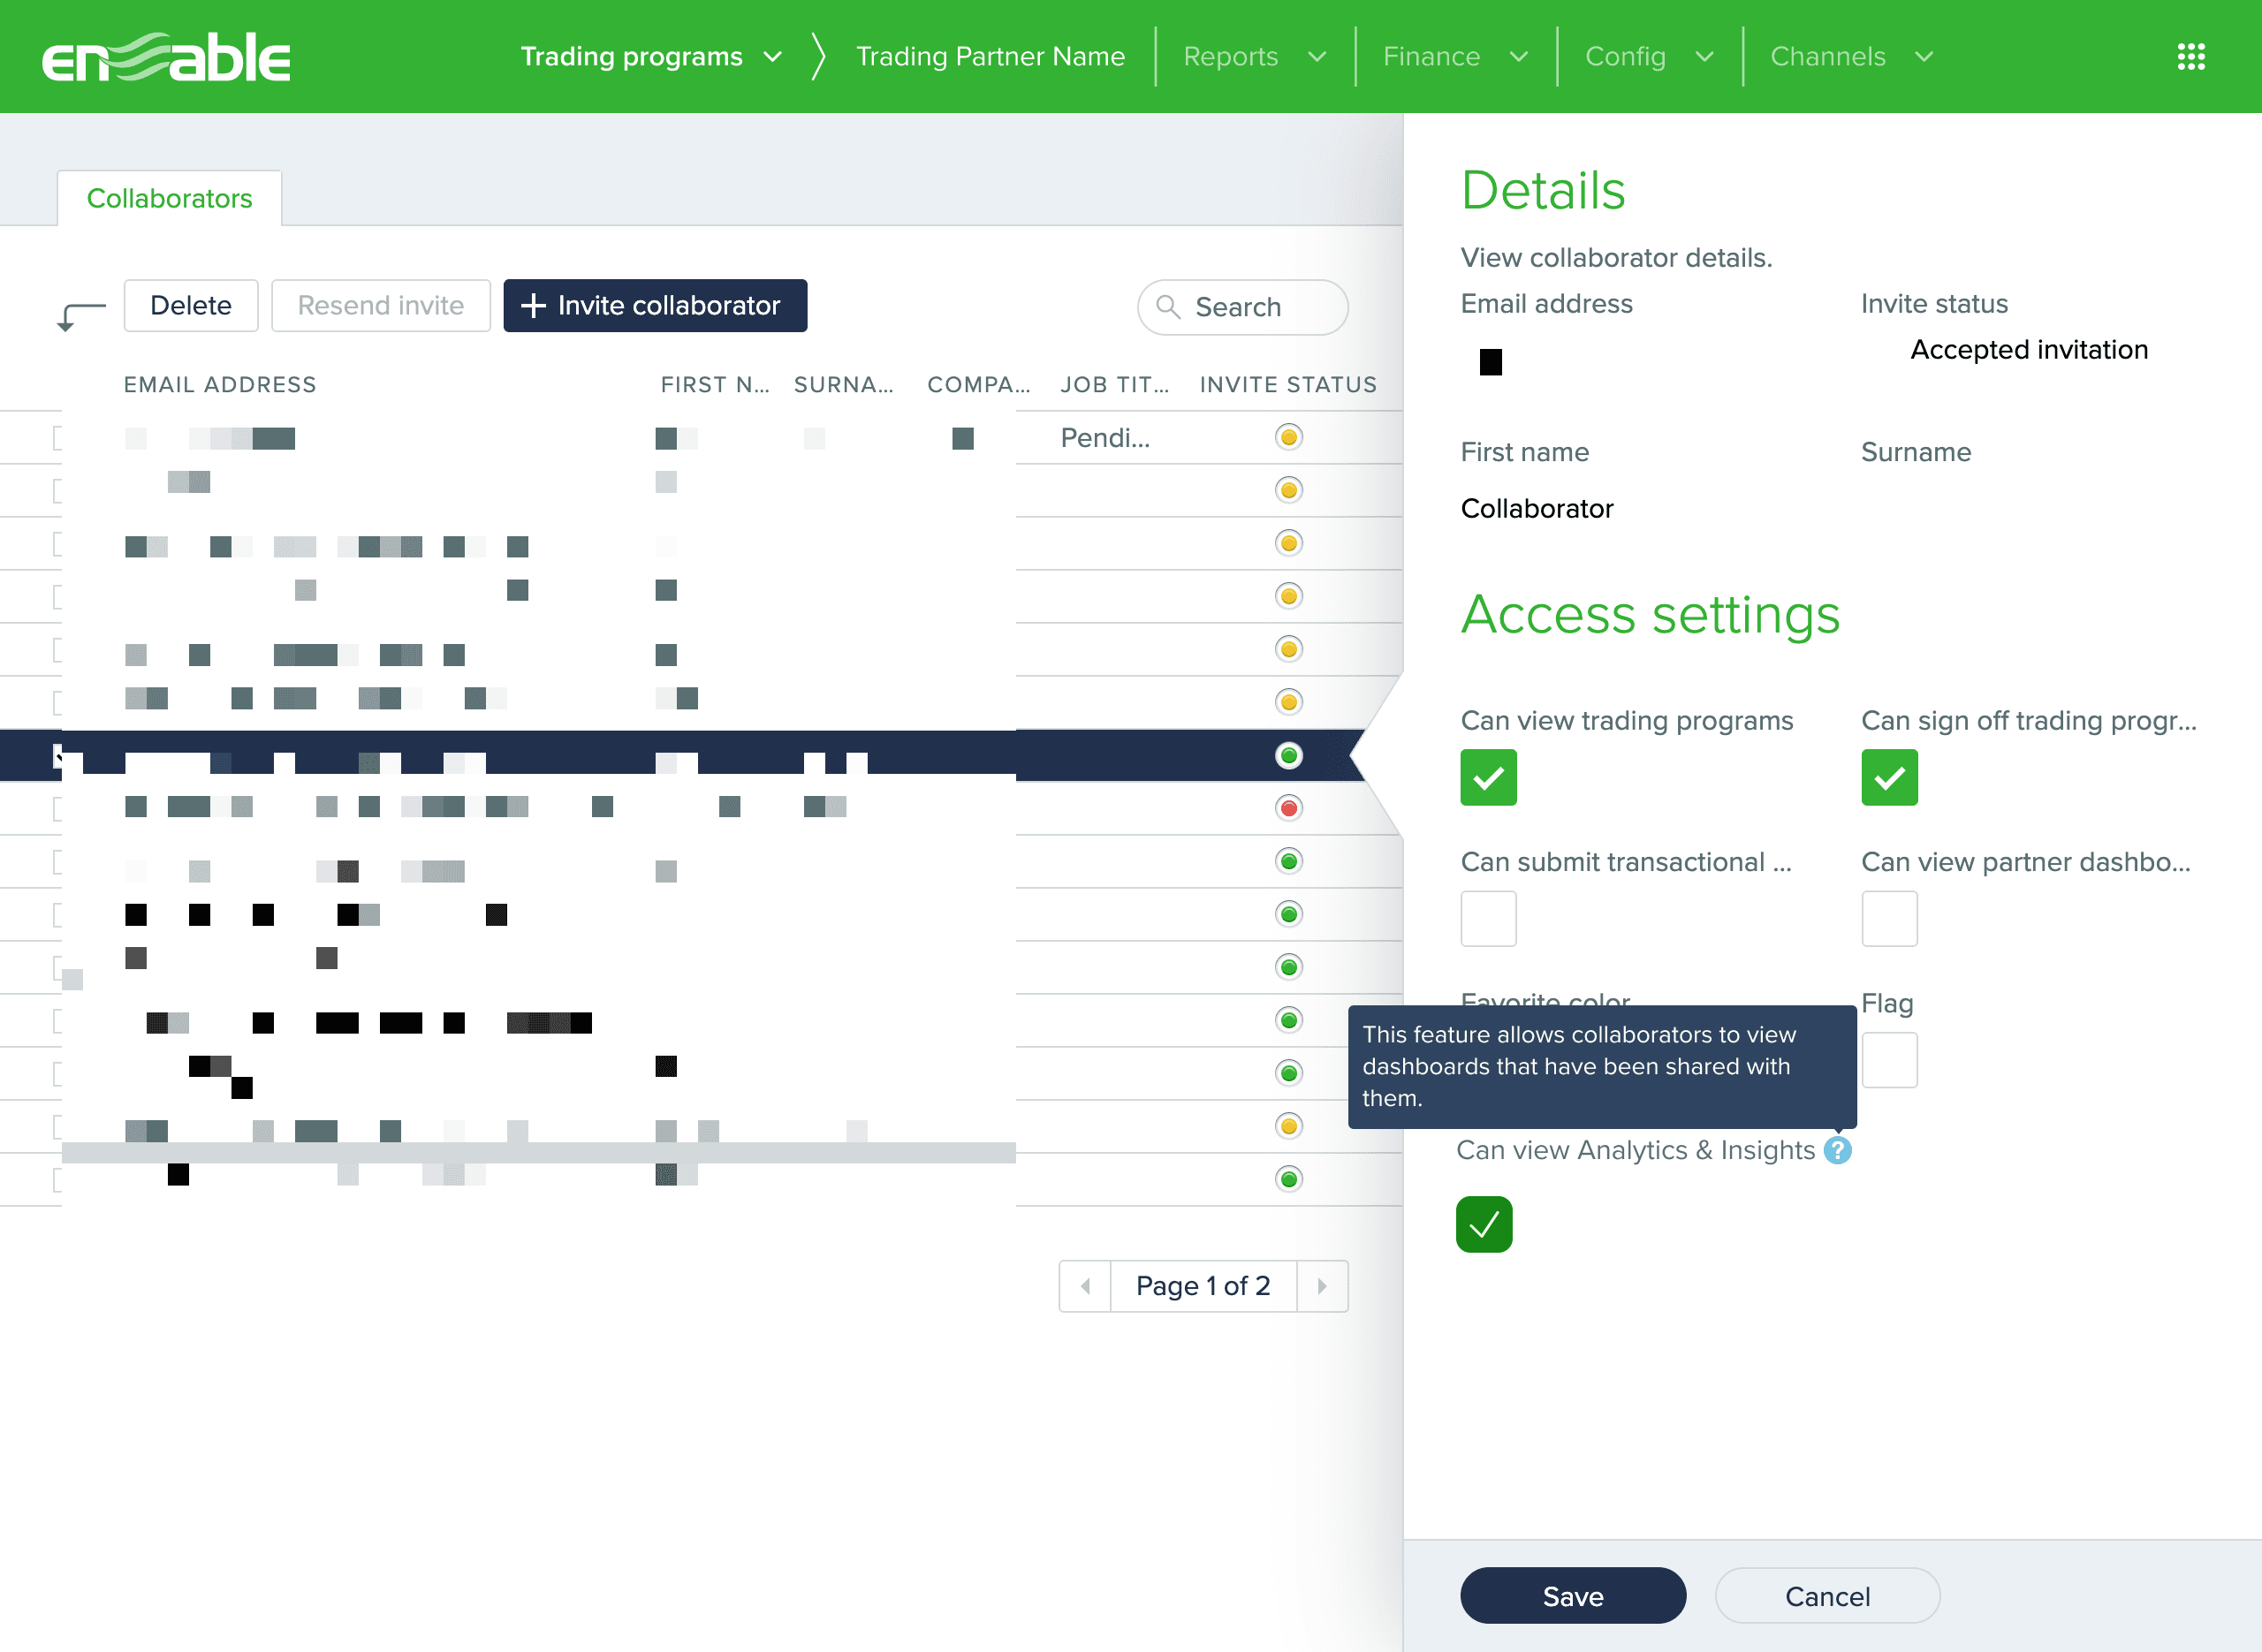
The handoff (share modal). From any dashboard, the analyst shares to trading partners: collaborator groups pulled automatically from the trading-programs system of record (no manual user lists), single-collaborator access control and revocation at GA, with bulk tools and buying-group pseudo-member support completing the permission model in June. The modal carries the collaborator-sharing patterns I designed, alongside the component stories I filed for the rebranded Collaborator surface, the design-system leads owned the component designs themselves; my screens defined what was needed.
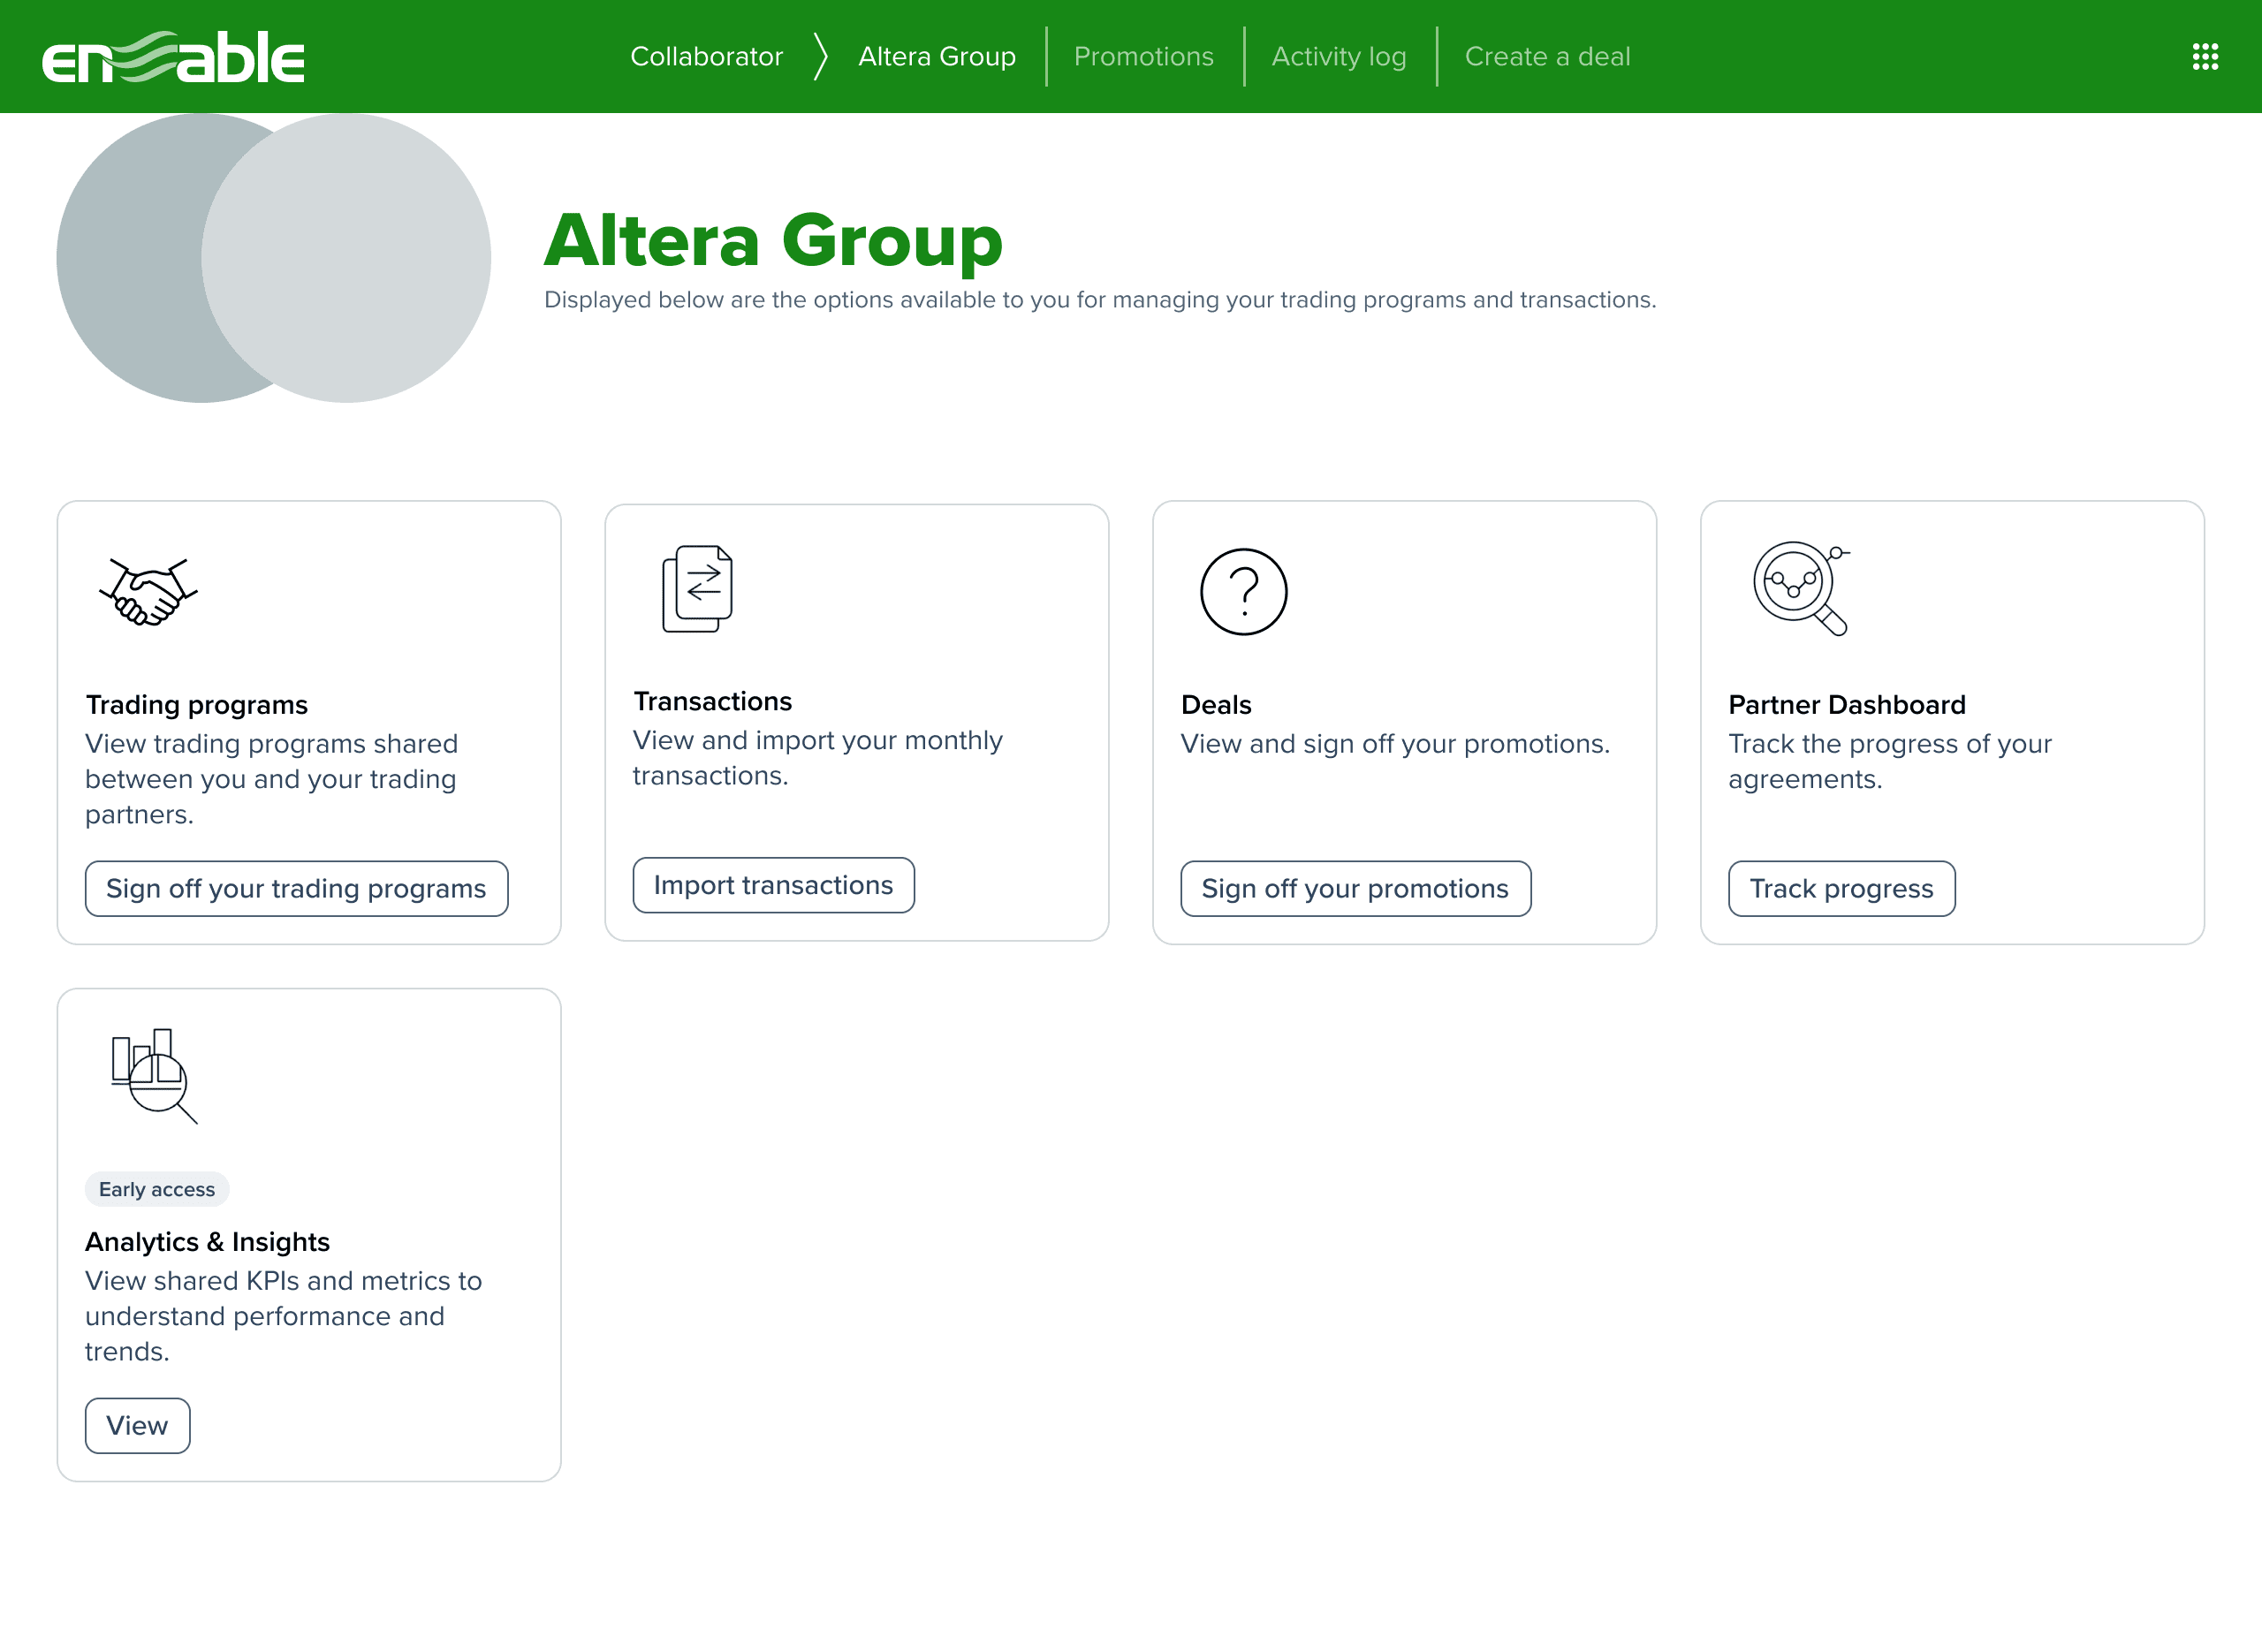
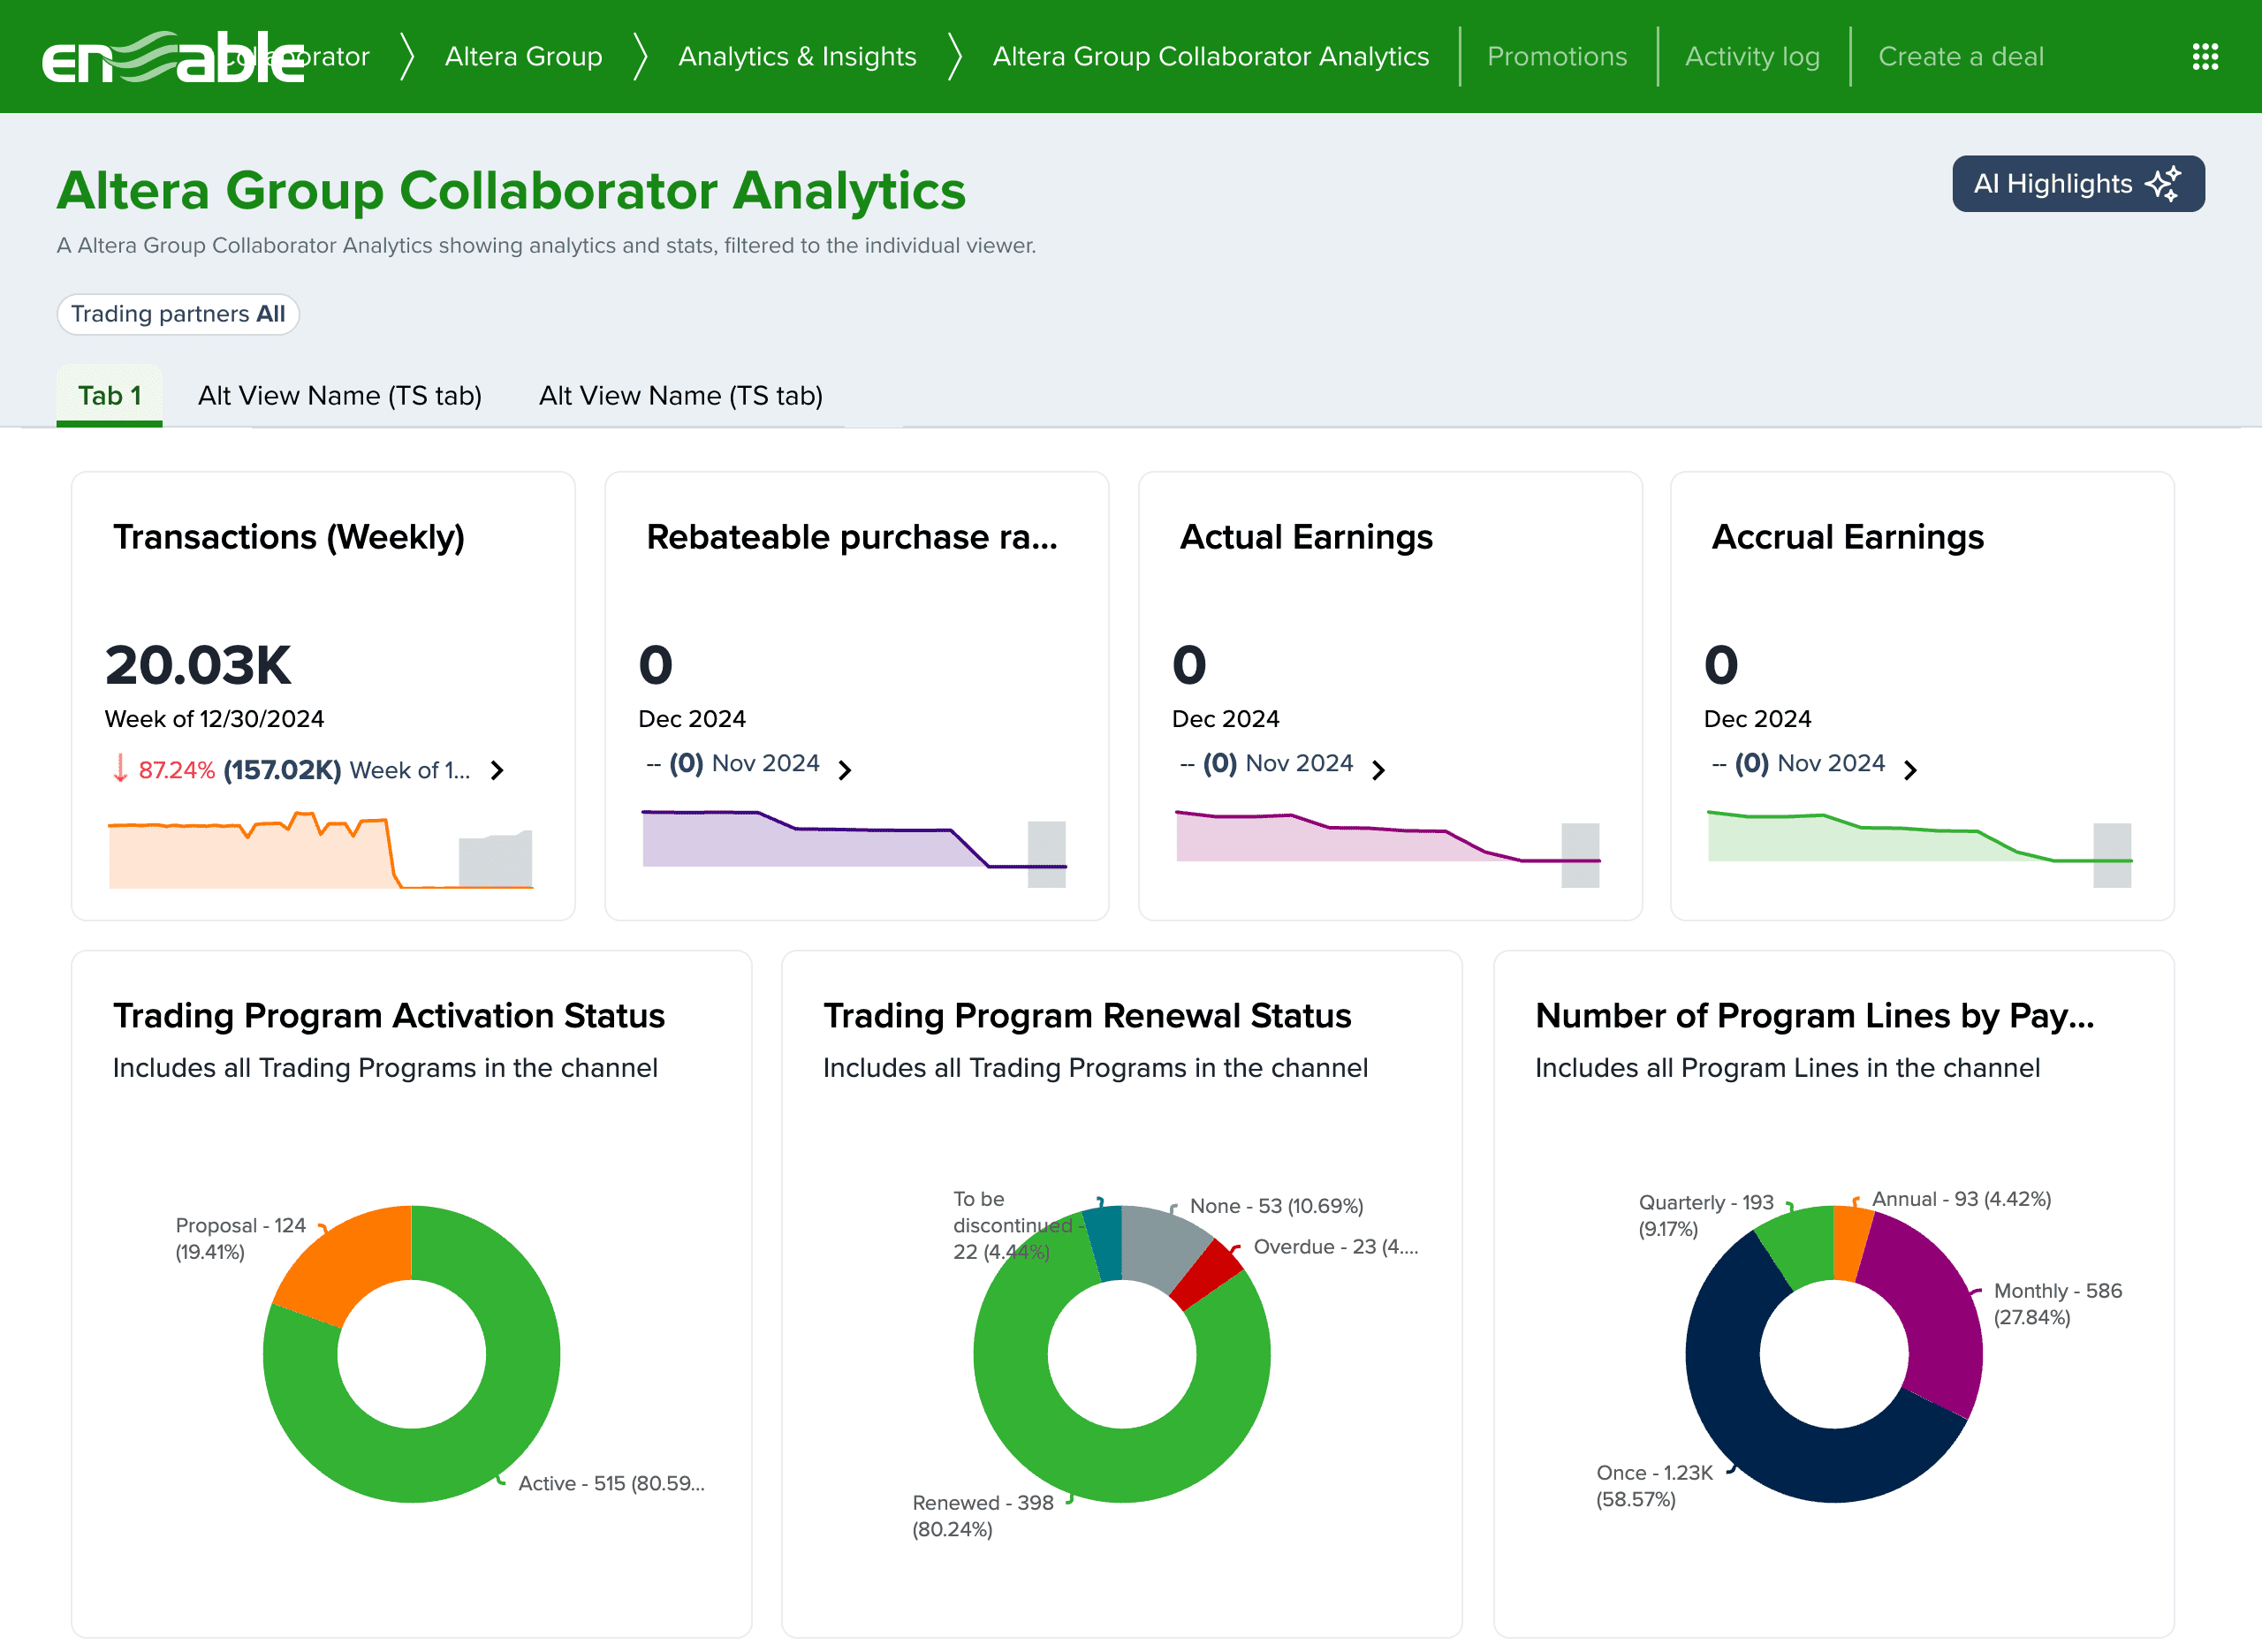
Partner side (Collaborator Portal). The partner opens the Analytics & Insights tile next to the legacy dashboard tile they already knew, the old and new worlds visible in one screen, and lands in a live dashboard filtered to exactly their slice: KPIs, program-line summary, change analysis, drill-through to transaction level, downloads. Multiple dashboards if the customer shares them; always current, never an export.
(7)
Designing the AI experience
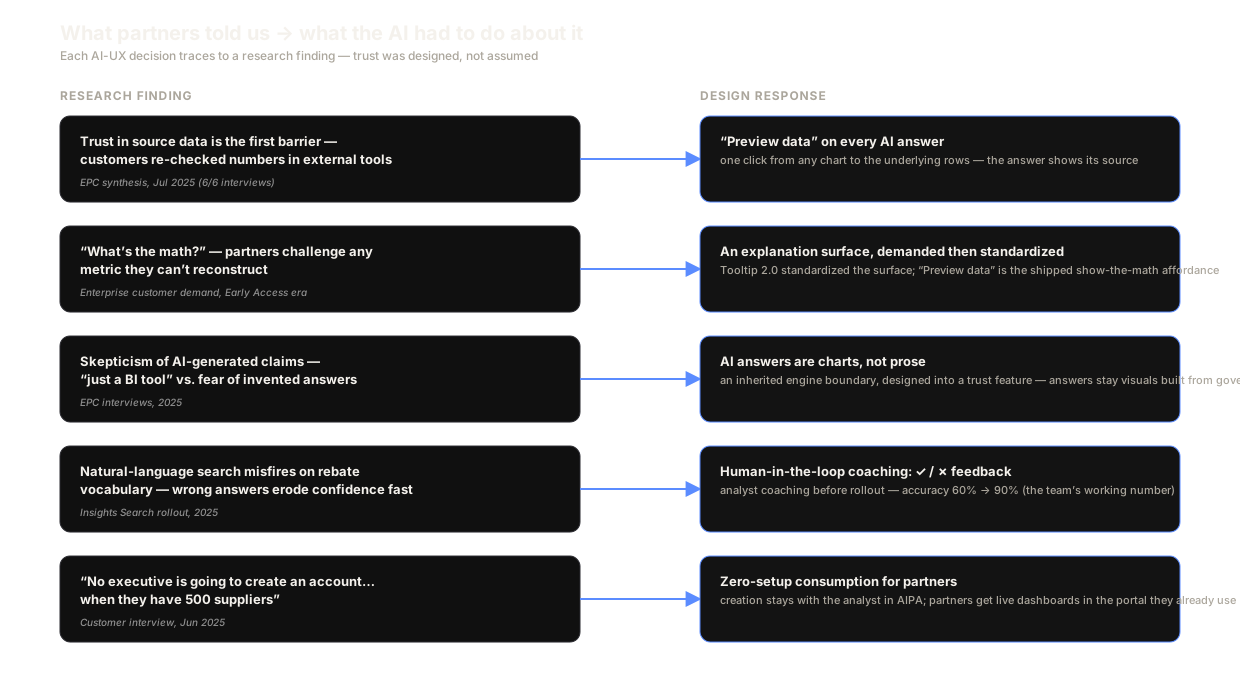
This is the section I'd defend in a design review. Every AI-trust pattern in the product answers a specific, sourced finding, none of it is AI theater.
Two smaller patterns I'd highlight: the first-run welcome modal for Insights Search (expectation-setting before the first question, the cheapest trust mitigation there is), and promising only what the engine could keep: the API spike showed the embed builds visualizations only, at ~19-second conversational turns, so nothing in the UI suggests a chatbot.
(8)
Craft and edge cases
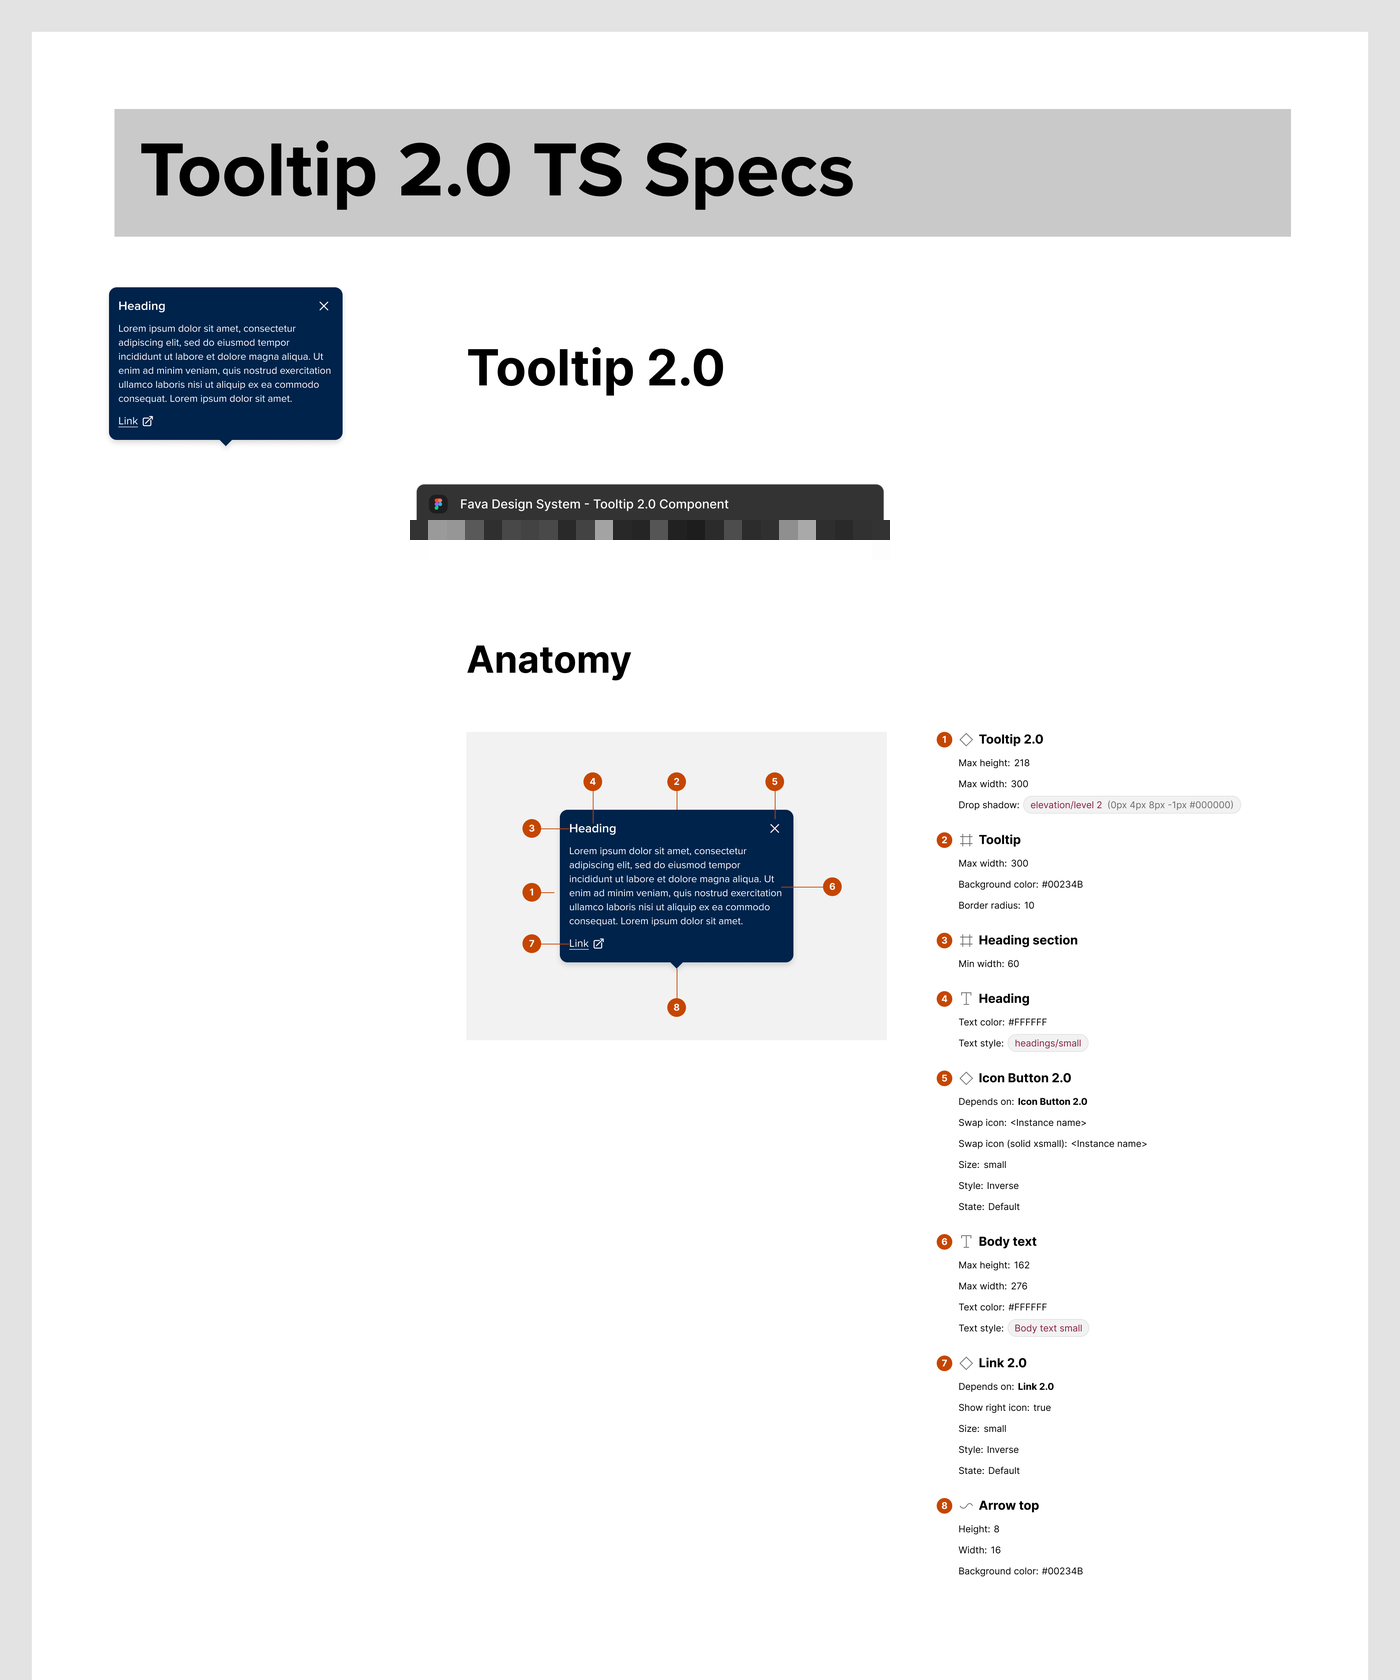
- Design-system reconciliation with a vendor embed: Tooltip 2.0 across click and hover tooltips, Modal 2.0 alignment, and seven component stories (cards, filters, toasts, modals, buttons) for the rebranded Collaborator surface, filed as individually-scoped engineering tickets, because inside an embed, “restyle the tooltips” is not one task.
- The misleading-percentage problem: the vendor's default period comparison produces technically-true-but-wrong statements (“June is 99.88% lower”, a partial June measured against all of May). Documenting and designing around vendor math you can't change is unglamorous and essential.
- Vendor language leakage: the team logged ThoughtSpot terminology surfacing in customer-facing UI at GA week.
- Honest gap: the platform's non-functional requirements committed to WCAG 2.1 AA, but I found no accessibility audit artifact in the record, and I won't claim one.
(9)
Outcome and impact
$4M
expansion-ARR goal, set in the original product brief, and hit
52
customer contracts by Oct 2025, against a 50-in-year-one target
Mar 11
2026, GA on plan; full partner permissioning followed in June
What shipped, on the record: Early Release to a strategic design partner December 10, 2025; their full use case completed January 30, 2026, the engineering quarterly readout records the customer “expressed their happiness” with the bespoke distributor dashboards. Early Access February 11 to 17; GA March 11, 2026, shipping alongside the platform rebrand; full partner permissioning (all collaborator types, buying-group pseudo-members) June 10, 2026. Commercially it shipped for the whole customer base: included in Enable's top-tier plans, with an add-on path for everyone else.
What it achieved: The program hit its ARR goal, the $4M expansion-ARR target set in the original product brief, and partner sharing became part of why new customers bought: the growth loop the internal one-pager predicted, with collaborators as a high-conversion segment of the pipeline. On the platform side, AI-Powered Analytics reached 52 customer contracts by October 2025 against its 50-in-year-one target, and the strongest single account of the analytics value is a design partner whose team described going from 45 to 60 minutes of report-and-pivot work to an immediate answer, training 30+ purchasing managers on the tool.
It wasn't a straight line, that's the point. Early on, usage lagged contracts badly: roughly 15 customers live by spring 2026, monthly active customer counts of 20 to 25 through fall 2025. That gap is exactly what my research program was commissioned to explain, and the research-driven iteration is what turned adoption around and got us to the goal. A launch that recovers because the team did the work is a stronger proof of process than one that never wobbles.
One measurement footnote, kept honest: PA&I's own launch KPIs (10 customers in 3 months; collaborator logins 790→920/week; >170 monthly dashboard viewers) were never formally tracked, the PM and PMM left within weeks of GA, the launch plan's tracking row still reads “Not Started,” and the early-access survey was drafted but never fielded. So the PA&I-specific outcome here rests on my account plus what's on the record: a validated design-partner deployment, two early-access customers signed and in implementation, each with a rollout shape scoped on the record, a competitive analysis that found no competitor that appears to offer customizable partner-facing analytics, and a follow-on roadmap (buying-group pseudo-members, indirect rebates, an Australia-region instance) born from early-access demand.
(10)
Reflection
This project worked because it rode two truths the research kept surfacing, instead of fighting them.
First, Enable had already won the position that mattered. We amalgamated rebate data from our customers' different systems, took it in, and became the source of truth for their rebates. Once that's true, analytics stops being a feature and becomes an obligation: the numbers two companies argue from should come from the system both sides already trust.
Second, customers were telling us what to build by what they kept rebuilding. They were pulling data out of Enable into Tableau and Power BI to visualize it and build custom dashboards, and then sharing those with their trading partners by hand, over and over. Partner Analytics & Insights closed that loop: share from the source of truth instead of exporting to rebuild somewhere else. That's also why it sold, partner sharing became part of why customers bought more, not just something existing customers used.
The deeper lesson for me is about when research pays. Adoption after the platform's first launch wasn't great, that's in the record above, and I lived it. The research program I built wasn't a discovery ritual; it was the turnaround mechanism. Watching adoption recover and the $4M ARR goal get hit after we did the research properly is the strongest argument I have for treating research as an adoption lever, not a pre-design phase.
What I'd do differently: make measurement a launch deliverable. The success metrics were defined and the tracking links existed, but the instrumentation lived in people, and when the PM and PMM left, the measurement left with them. Next time, the dashboard that tracks the launch ships with the launch.
And the question this project always raises: would I make the ThoughtSpot bet again? Honestly, no. The 2024 business case was sound math against the wrong requirement: it priced building a full BI platform, years of work, dozens of engineers, against buying one, and buying won. But the research we ran afterward showed our users didn't need a full BI platform. They needed governed, curated, shareable insight on rebate data, a much narrower thing, and one a focused in-house build could have delivered for less than the vendor bill plus the design tax of living inside an embed: the string IDs, the modal limits, the latency ceilings, a rebrand that could only skin the edges. Owning the surface would have let us shape the experience around customers instead of negotiating with a vendor's grammar. That's why, looking forward, the direction we set was to build our own, and if I'd been in the room at the start, with the user understanding we only built later, I'd have argued for it then.
Next Project
Enable
Catalyze